
GENETIC DIVERSITY OF TRIPLOPHYSA YARKANDENSIS POPULATIONS IN TARIM RIVER BASIN IN XINJIANG
-
摘要: 为探究新疆塔里木河叶尔羌高原鳅(Triplophysa yarkandensis)遗传多样性现状, 研究基于线粒体Cytb和D-loop序列对塔里木河两条支流(车尔臣河和渭干河)的8个地理群体进行了遗传学多样性和遗传结构分析。结果显示, 基于Cytb和D-loop序列分别获得了41和51个单倍型, 单倍型多样性指数/核苷酸多样性指数分别为0.9247±0.0124/0.9776±0.0032和0.0065±0.0034/0.0115±0.0058, 表明各群体的遗传多样性水平均较高。AMOVA结果显示, 遗传变异主要来自群体内部(Cytb Fst=96.57%; D-loop Fst=95.25%), 仅有3.43%(Cytb)和4.75%(D-loop)来自群体间; 各群体间的遗传距离值小, 遗传分化指数Fst值低, 属于弱分化水平。基于样本构建的系统发育树和单倍型构建的网络进化图均显示, 各群体的样本没能形成明显的地理聚群和谱系结构。虽然两支流群体间存在潜在的遗传障碍, 并发生了一定的遗传分化, 但其遗传距离值只在0.05附近(Cytb, Fct=0.0540; D-loop, Fct=0.0471)。种群历史动态分析结果表明, 叶尔羌高原鳅种群相对稳定, 未经历过明显的扩张。综合上述结果, 塔里木河叶尔羌高原鳅群体遗传多样性水平较高, 但是遗传分化主要来源于群体内部, 群体间有明显的基因交流, 建议将其作为一个保护管理单元进行保护。研究为叶尔羌高原鳅种质资源开发利用、制定合理的保护措施提供了基础数据。Abstract: The distribution of Triplophysa yarkandensis is restricted in the Tarim River basin. Due to the gradual depletion of water resources, together with alien invasion and agricultural cultivation in Tarim River, the population size of T. yarkandensis has been diminishing and critically endangered. Changing this trajectory will require coordinated researches and conservation strategies to provide a better understanding of population genetics at large spatial scales. To accomplish it, eight populations of T. yarkandensis were collected from Qarqan River and Weigan River, and the genetic diversity, population structure and population dynamics were analyzed by sequencing the mitochondrial cytochrome b (Cytb) gene and control region (D-loop). Based on the Cytb and D-loop sequences, 41 and 51 haplotypes were detected, and the haplotype diversity/nucleotide diversity were 0.9247±0.0124/0.9776±0.0032 and 0.0065±0.0034/0.0115±0.0058, respectively, indicating a high genetic diversity. The AMOVA results showed that, the genetic variations mainly derived from intrapopulation (Cytb Fst=96.57%; D-loop Fst=95.25%), with only 3.43% (Cytb) and 4.75% (D-loop) from inter-populations. In addition, the low genetic distance and genetic differentiation index Fst between populations and no obvious geographical clustering and pedigree structure formatting according to the phylogenetic tree and network evolution diagram of haplotypes analyzing revealed a small degree of genetic differentiation among populations. Although there were potential genetic barriers and genetic differentiation between populations from Weigan River and Qarqan River, the genetic distance value was only around 0.05 (Cytb, Fct=0.0540; D-loop, Fct=0.0471). The results of neutrality test and nucleotide mismatch distribution plotting indicated that T. yarkandensis populations in Tarim River basin were relatively stable and no obvious population expansion occurred recently. To sum up, the genetic diversity of T. yarkandensis populations in Tarim River relative higher, but the genetic divergence was mainly from intrapopulation, and obvious gene flow between populations in the studied area was supported by our results. Thus, we suggest protecting it as one protection unit. These results provide valuable genetic data for developing scientific management strategies and directing future monitoring and utilization of the wild resource of T. yarkandensis in Tarim River basin.
-
Keywords:
- Cytb /
- D-loop /
- Genetic diversity /
- Genetic structure /
- Tarim River /
- Triplophysa yarkandensis
-
叶尔羌高原鳅(Triplophysa yarkandensis), 俗称“狗头鱼”, 是新疆南部塔里木河水系的特有鱼类, 隶属于鲤形目鳅科(Cobitidae), 条鳅亚科(Noemacheilinae), 是高原鳅属(Triplophysa)鱼类中个体最大、生长速度最快的经济鱼种, 迄今发现的最大个体长30 cm、重305 g[1]。近几十年来, 塔里木河干流水流量日益减少, 盐碱化程度加剧, 加之大量滥捕、外来入侵鱼类捕食等, 导致叶尔羌高原鳅种群数量急剧减少, 即将成为继扁吻鱼和塔里木裂腹鱼之后的又一濒危物种[2]。遗传多样性是物种繁衍、抵抗疾病和适应环境变化的物质基础, 因此, 开展叶尔羌高原鳅野生群体遗传多样性研究, 从分子水平分析其种群遗传结构特征和种群历史动态, 进而制定合理有效的保护方案, 对叶尔羌高原鳅的种质资源保护和科学开发利用有重要的意义。
线粒体DNA(mtDNA)是一种核外遗传物质, 因具有基因组小、结构简单、进化速度快、几乎不发生重组以及不同的区域进化速率存在差异等特点, 成为物种鉴定和群体遗传学研究的理想分子标记[3]。在mtDNA中, 细胞色素b(Cytochrome b, Cytb)基因的进化速度适中, 许多学者选择其作为分子标记, 用于分析种群母系起源、系统进化、遗传结构和遗传多样性等[4-6]; 控制区(D-loop)是线粒体上的一段非编码区, 由于受选择压力较小, 其进化速率是线粒体其他区域的5—10倍, 研究发现, 用D-loop序列进行群体遗传多样性和系统进化研究, 获得的信息更全面、结果更准确[7, 8]。近年来, 通过分析Cytb和D-loop序列的碱基信息研究水产动物遗传多样性已被广泛应用, 如Guo等[9]用Cytb和D-loop序列对雅鲁藏布江6个地理群体的拉萨裸裂尻鱼(Schizopygopsis younghusbandi)进行遗传多样性分析, 发现各群体的遗传多样性水平均较低, 并且遗传变异主要来自群体内部; 杜景豪等[8]用Cytb和D-loop序列对5个日本囊对虾(Penaeus japonicus)群体分析结果显示, 群体间遗传分化较明显, 近期未曾经历瓶颈效应和种群扩张。上述研究都为种质资源的保护与开发利用提供了重要的数据基础。
目前, 关于叶尔羌高原鳅的研究主要集中在基础生物学[11, 12]、繁殖习性[1, 10]、肌肉营养成分[13]和耐盐碱性[14, 16]等方面, 而在遗传多样性方面, 仅见王锦秀等[15]用SSR标记对塔里木河5个群体的研究报道。为了更多地了解塔里木河叶尔羌高原鳅的遗传多样性现状, 本研究采用线粒体Cytb基因和D-loop序列对塔里木河8个地理群体的遗传多样性进行分析, 研究其种群结构和历史动态信息等, 旨在为叶尔羌高原鳅的资源保护与科学开发利用提供理论依据。
1. 材料与方法
1.1 样品采集
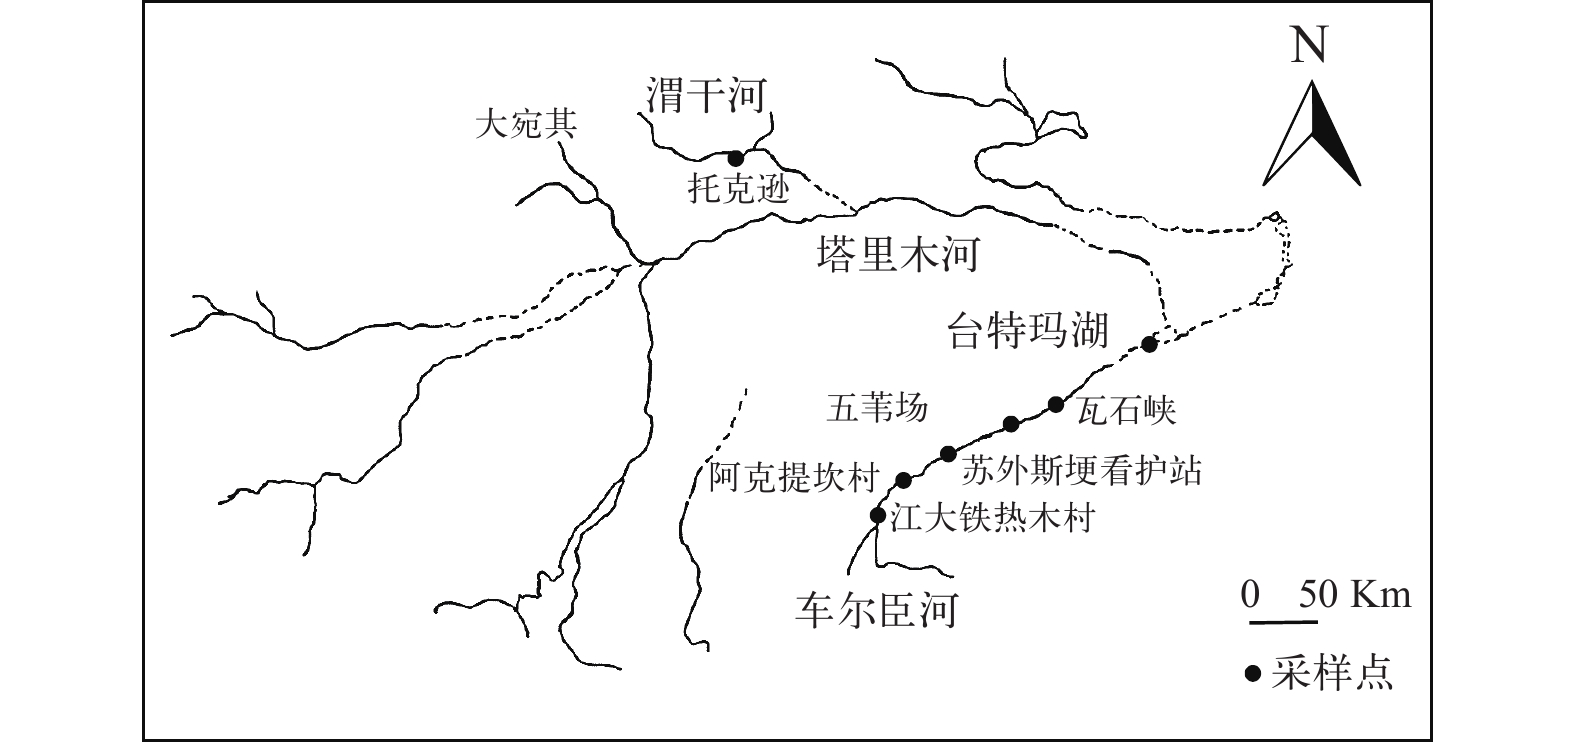
本研究所用叶尔羌高原鳅为2019年5至10月从塔里木河支流渭干河和车尔臣河采集, 其中拜城大宛其(DWQ)22尾、托克逊(TKX)20尾、且末第二分水枢纽(JDT)22尾、阿克提坎村(AKT)11尾、苏外斯埂管护站(SWS)23尾、且末五苇场(WWC)28尾、瓦石峡乡(WSX)21尾和台特玛湖(TTM)27尾, 共174尾(图 1)。根据形态学特征确认物种后, 取鳍条于100%乙醇中暂存, 运回实验室后置于–80℃冰箱中保存备用。
1.2 DNA提取、序列扩增及测序
取鳍条约30 mg, 用醋酸铵/异戊醇法提取基因组DNA[17], 分别用1%的琼脂糖凝胶电泳和NanoDrop 2000紫外分光光度计(Thermo Scientific, USA)检测DNA的质量和浓度。将合格的DNA稀释至50 ng/μL用于后续实验。
分别采用Xiao等[18]和Liu等[19]的引物扩增Cytb和D-loop序列, 具体为: Cytb F: 5′-GACTTGAAAAACCACCGTTG-3′, R: 5′-CTCCGATCTCCGGATTACAAGAC-3′; D-loop F: 5′-ACCACTGGCTCCCAAAGC-3′, R: 5′-ATCTTAGCATCTTCAGTG-3′。PCR反应体系30 μL, 包括: DNA模板3 μL、上下游引物各0.75 μL(10 μmol/L), 2×PCR Master Mix 15 μL, ddH2O 10.5 μL。PCR程序为: 94℃预变性5min, 35个循环[94℃变性30s, 退火30s(Cytb为56℃, D-loop为54℃), 72℃延伸50s], 72℃延伸10min。PCR产物经1%琼脂糖凝胶电泳检测为单一明亮的条带后送公司测序。
1.3 数据分析
测序结果用Bio Edit 7.0.5软件[20]进行编辑并人工校对, 然后用MEGA 7.0[21]将其与NCBI中叶尔羌高原鳅mtDNA(KT224367)中的Cytb和D-loop序列同源比对, 确认测序结果的准确性, 并统计序列的碱基组成、变异和群体间遗传距离; 用邻接法(Neighbor-joining, NJ)基于Kimura2-parameter(K2-p)模型构建样本系统发育树, 用Bootstrap(1000次)检验聚类树各分支的置信度。用DnaSP 5.1[24]统计多态位点数目(Number of polymorphic sites, S)、核苷酸多样性指数(Nucleotide diversity, Pi)、单倍型数目(Number of haplotype, H)、单倍型多样性指数(Haplotype diversity, Hd)等。用PopART[22]构建单倍型网络进化图。用Barrier v.2.2[23]分析群体间的遗传障碍。用Arlequin 3.5[25]进行AMOVA分析(Analysis of molecular variance)计算群体内和群体间的遗传变异, 并进行Tajima’s D[26]和Fu’s Fs [27]中性检验以及核苷酸不配对分布分析(Mismatch distribution)研究群体是否发生扩张。
2. 结果
2.1 序列组成及变异
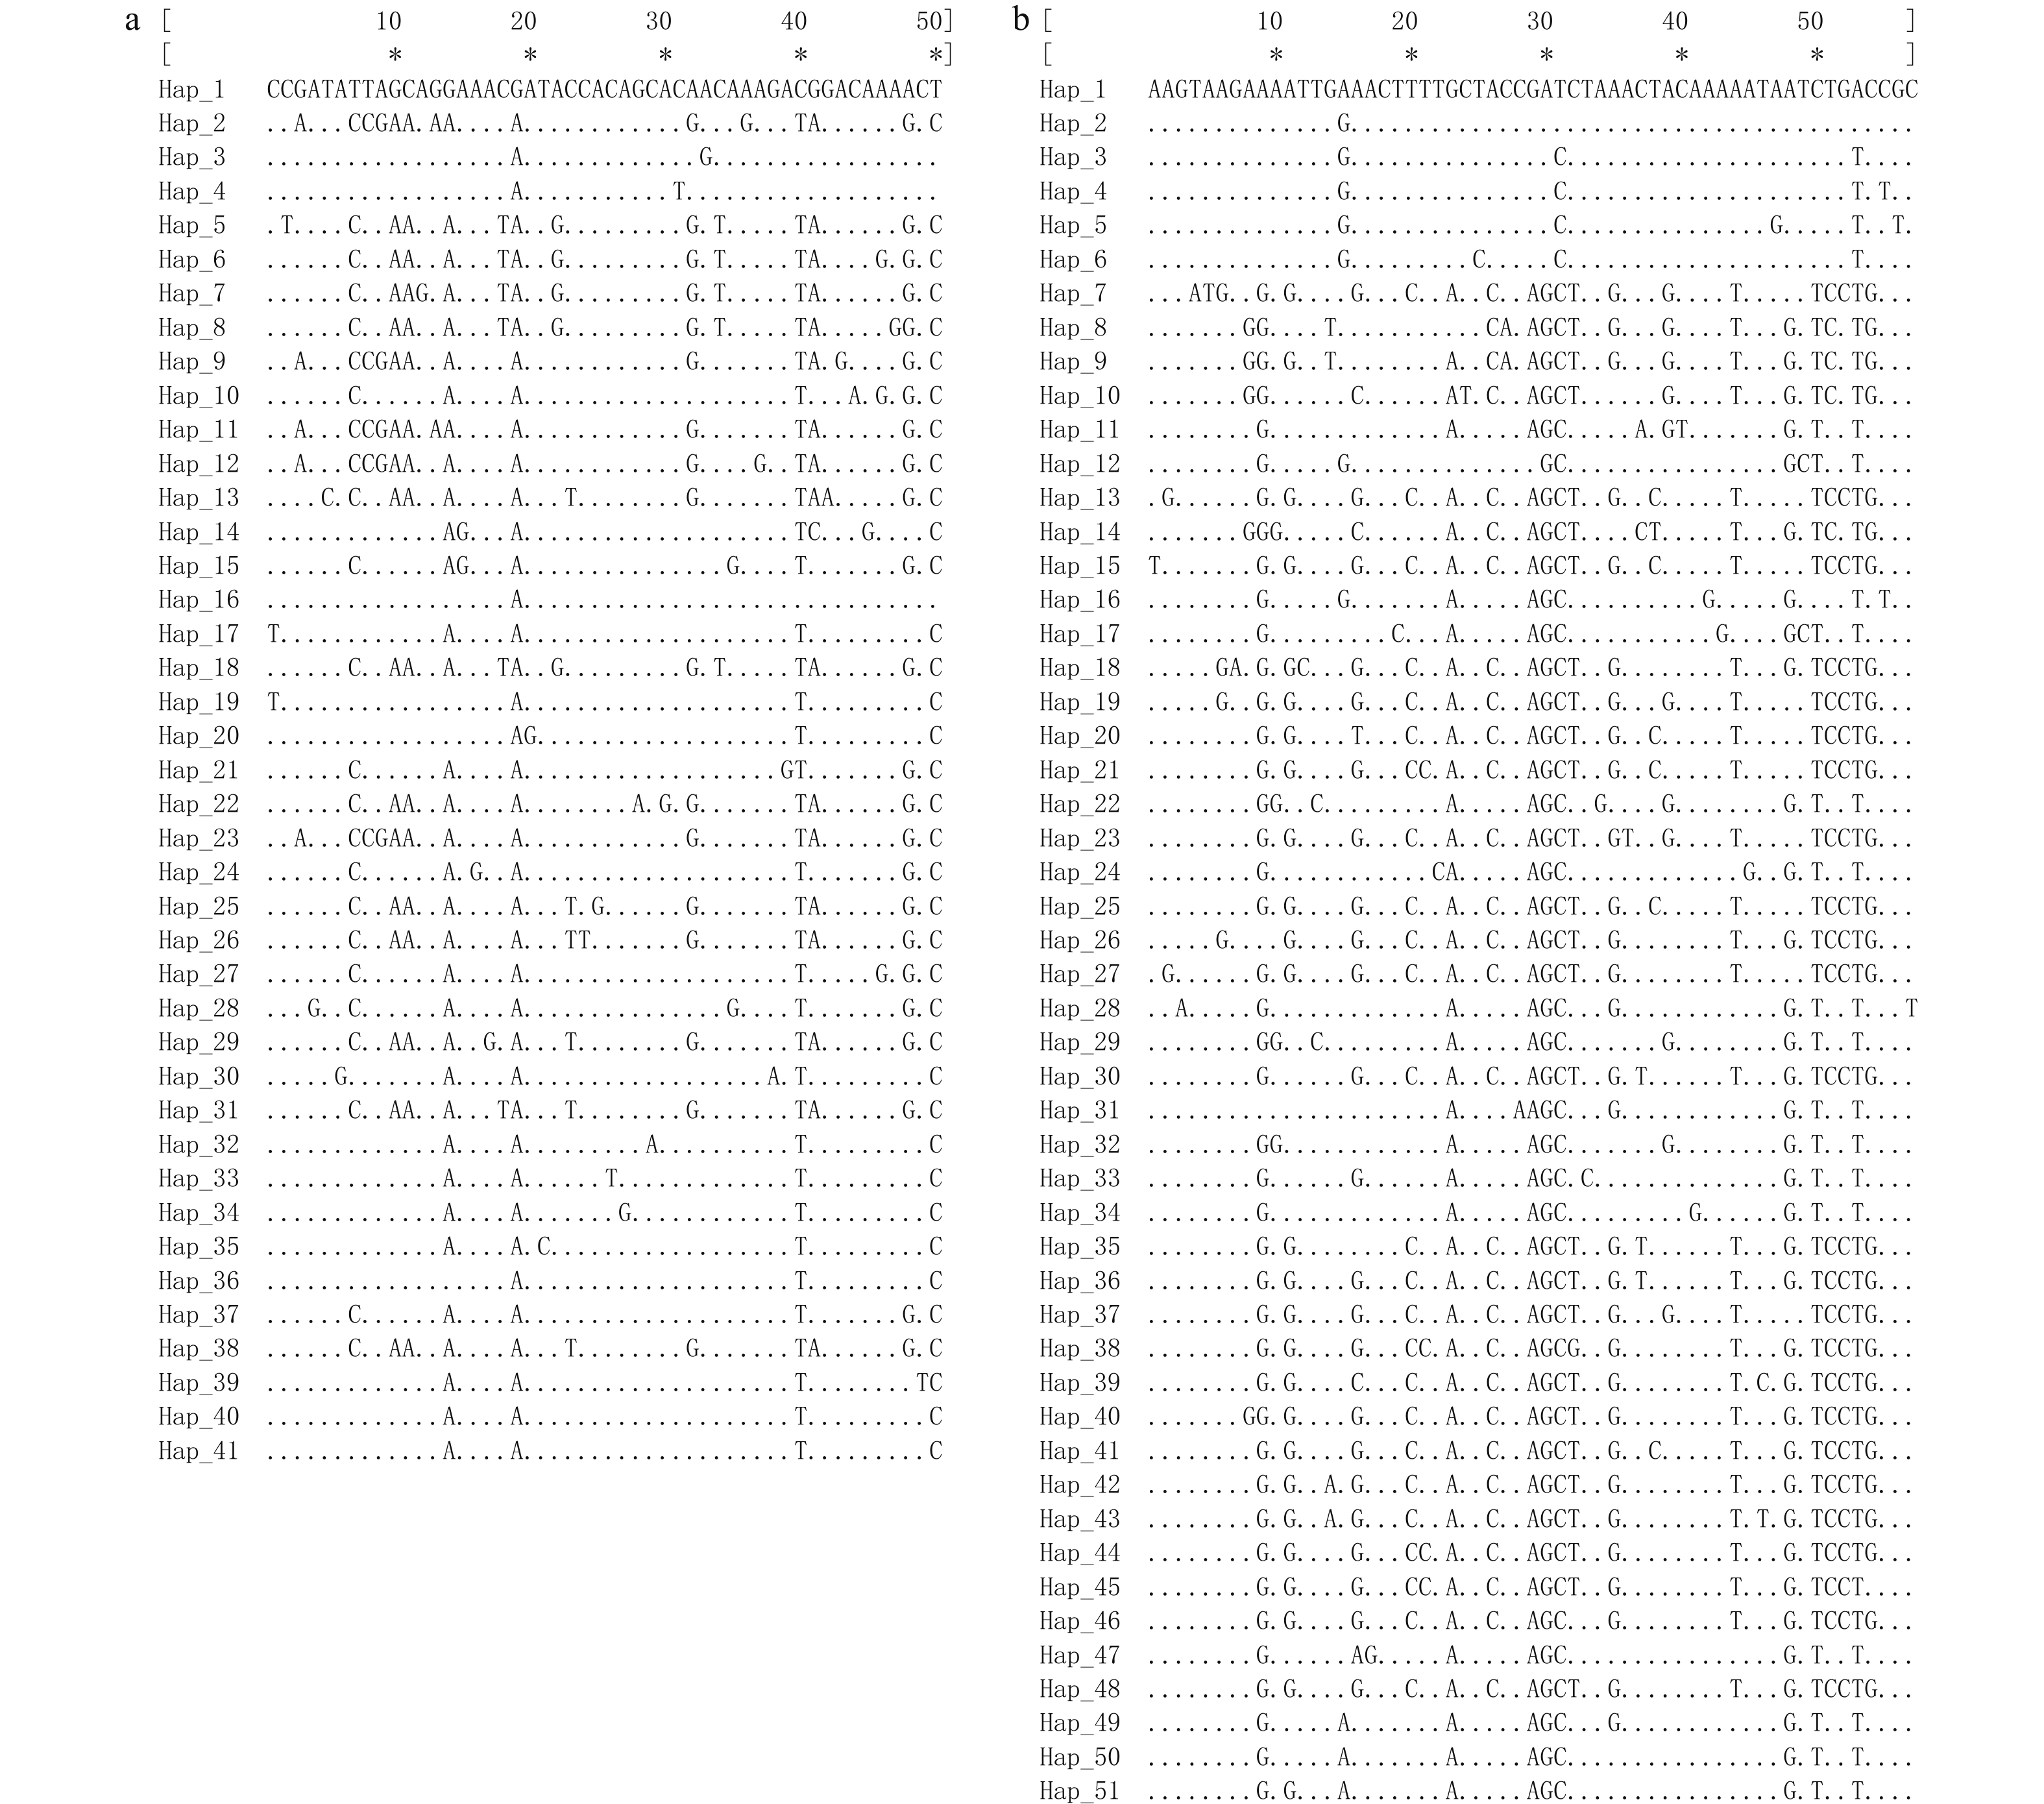
测序结果经校正和比对后, 分别选取1079 bp的Cytb和887 bp的D-loop序列用于后续分析。结果显示, 两序列的A、T、C、G平均含量分别为24.0%、33.1%、25.7%、17.2%和32.5%、31.1%、21.3%、15.1%、63.6%, A+T含量(Cytb, 57.1%; D-loop, 63.6%)均显著高于G+C含量(Cytb, 42.9%; D-loop, 36.4%)。Cytb的多态性位点数为50个, 包括40个简约信息位点和10个单一突变位点; D-loop的多态位点数为57个, 包括47个简约信息位点和10个单一突变位点; 两序列的碱基转换与颠换比分别为9.8﹕1和2.9﹕1。碱基突变位点如图 2所示。
![]() 图 2 叶尔羌高原鳅Cytb (a)与D-loop (b)序列的变异位点图Figure 2. The genetic variation loci of T. yarkandensis in Cytb (a) and D-loop (b) sequences
图 2 叶尔羌高原鳅Cytb (a)与D-loop (b)序列的变异位点图Figure 2. The genetic variation loci of T. yarkandensis in Cytb (a) and D-loop (b) sequences2.2 群体遗传多样性
基于Cytb序列共检测到41个单倍型(图 2), 其中, Hap-41为8个群体共有单倍型。单倍型多样性指数(Hd)为0.9247±0.0124, 核苷酸多样性指数(Pi)为0.0065±0.0034; SWS群体的Hd和Pi指数最高, JDT群体最低。基于D-loop序列共检测到51个单倍型, 没有发现所有群体的共享单倍型, Hd为0.9776±0.0032, Pi为0.0115±0.0058; AKT群体的Hd指数最高, 而TKX群体的Pi
指数最高。此外, 基于D-loop分析得到的单倍型数量、Hd和Pi均高于基于Cytb序列的分析结果(表 1)。 表 1 叶尔羌高原鳅各群体的遗传多样性参数Table 1. Genetic diversity parameters in each population of T. yarkandensis基因Gene 群体Population 单倍型数H 单倍型多样性指数Hd 核苷酸多样性指数Pi 平均核苷酸差异数K Cytb AKT
DWQ
TKX
SWS
JDT
WSX
WWC
TTM7
8
7
17
11
10
18
140.9091±0.0656
0.8745±0.0374
0.8526±0.0394
0.9526±0.0335
0.8458±0.0589
0.9143±0.0364
0.9444±0.0295
0.9259±0.02740.0062±0.0036
0.0057±0.0032
0.0053±0.0030
0.0068±0.0037
0.0052±0.0029
0.0068±0.0037
0.0060±0.0033
0.0094±0.00496.4180
5.8790
5.3120
6.9490
5.3120
6.9950
6.1400
6.2790D-loop AKT
DWQ
TKX
SWS
JDT
WSX
WWC
TTM10
14
12
17
13
11
18
160.9818±0.0463
0.9437±0.0299
0.9263±0.0378
0.9605±0.0272
0.9437±0.0282
0.9333±0.0296
0.9630±0.0181
0.9402±0.02700.0097±0.0055
0.0119±0.0063
0.0121±0.0064
0.0114±0.0060
0.0106±0.0057
0.0119±0.0063
0.0100±0.0053
0.0107±0.00578.3820
9.9870
10.2370
9.6050
8.5340
10.0100
8.2720
8.7690Cytb
D-loop总体
Total41
510.9247±0.0124
0.9776±0.00320.0065±0.0034
0.0115±0.00586.3790
9.58202.3 群体遗传结构与系统发育
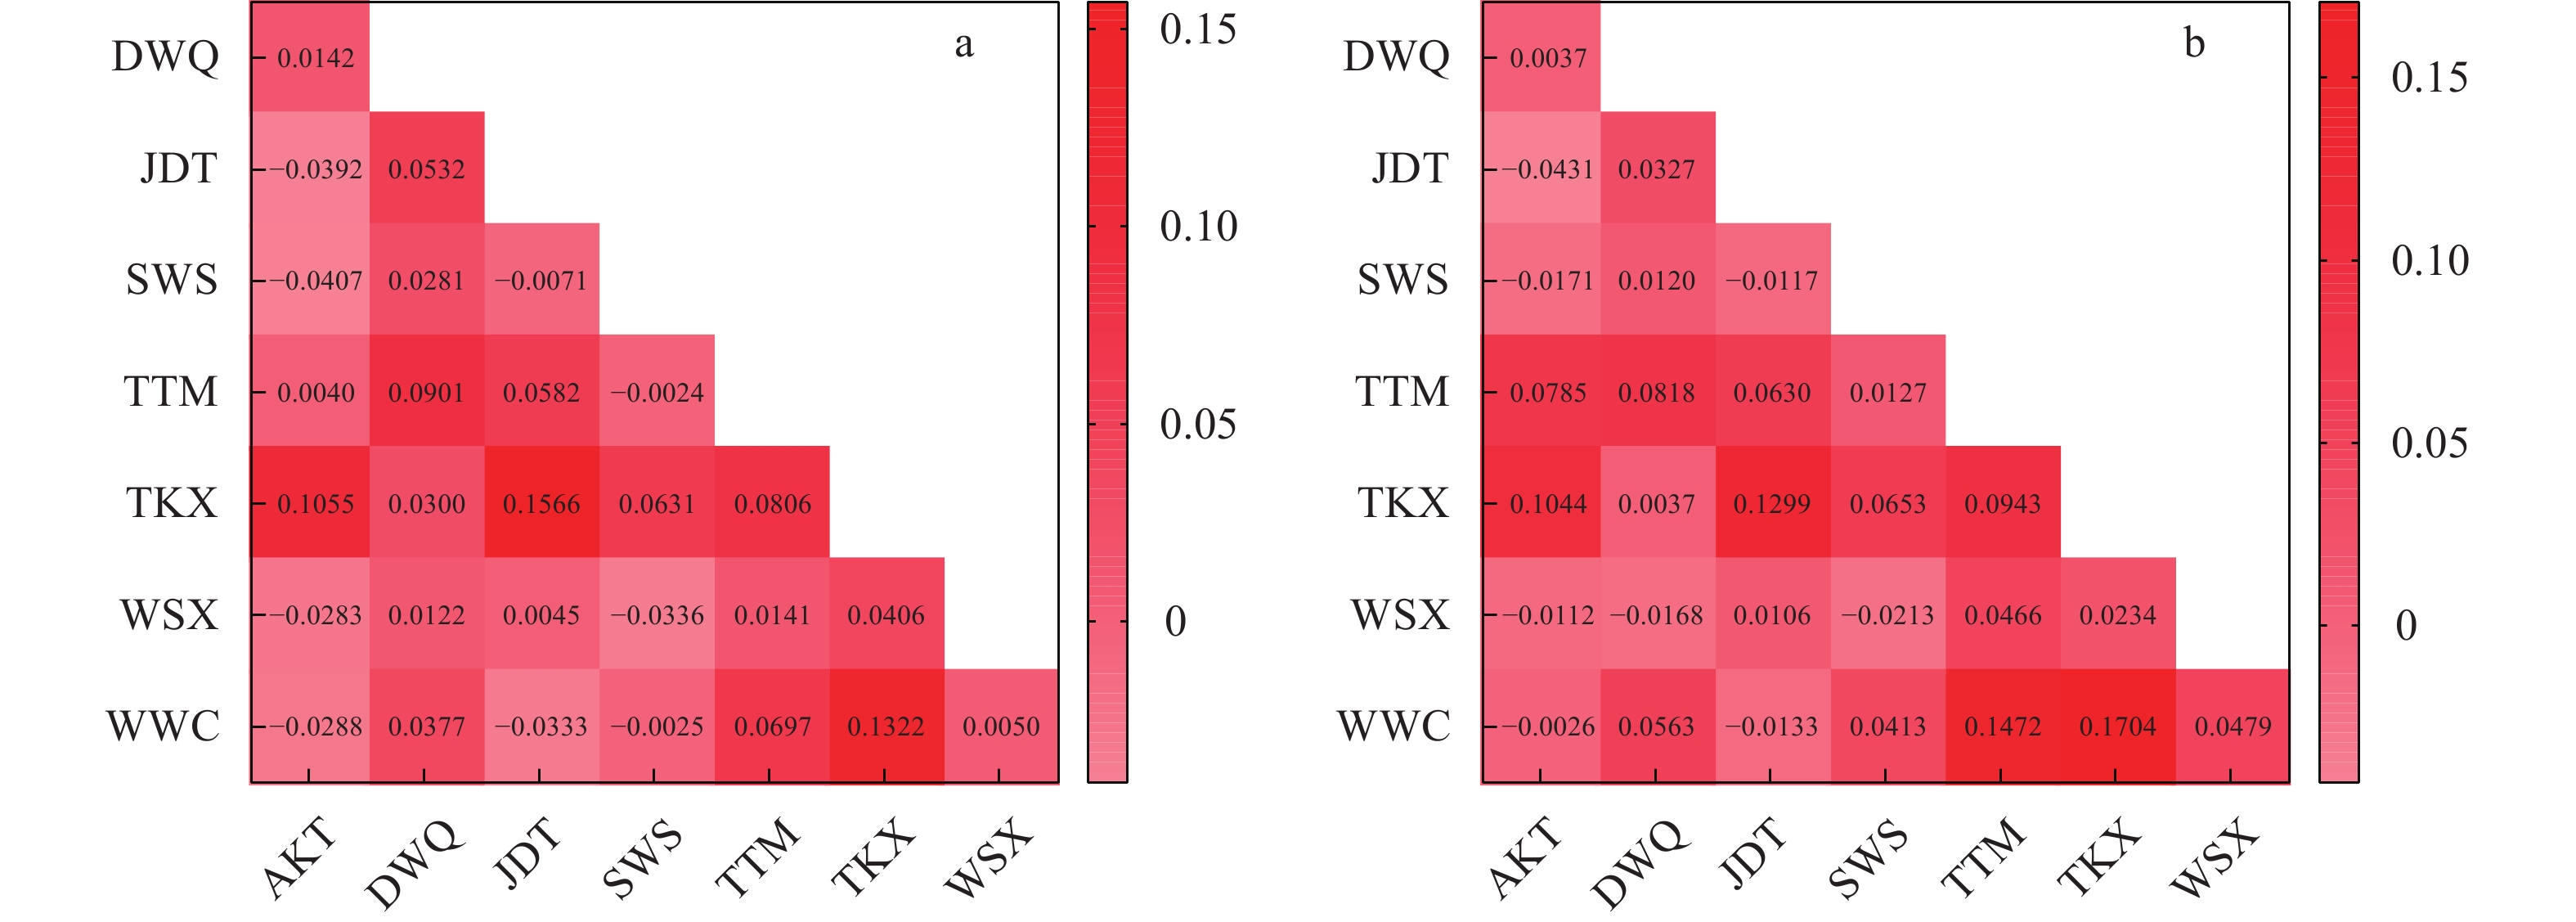
遗传分化指数(Fst)表示群体间的遗传分化程度, 通常分为3个等级: 弱分化(Fst<0.05)、中度分化(0.05≤Fst≤0.25)和高度分化(Fst>0.25)[28]。在本研究中, 除TTM和TKX群体与其他群体间的Fst在0.05—0.25, 属于中度分化外, 其他群体间的Fst均小于0.05, 属于弱分化水平(图 3)。同时, 各群体间的遗传距离小, 其范围分别为0.0055—0.0071(Cytb)和0.0092—0.0128(D-loop; 表 2), 表明群体间具有较高的遗传同质性。
![]() 图 3 基于Cytb(a)和D-loop(b)序列的群体间遗传分化指数(Fst)Figure 3. Pairwise Fst between pairs of populations based on Cytb (a) and D-loop (b) sequences表 2 基于Cytb(对角线下)和D-loop(对角线上)序列的叶尔羌高原鳅群体间遗传距离Table 2. Genetic distance between populations of T. yarkandensis based on Cytb (under the diagonal) and D-loop (on the diagonal) sequences analysis
图 3 基于Cytb(a)和D-loop(b)序列的群体间遗传分化指数(Fst)Figure 3. Pairwise Fst between pairs of populations based on Cytb (a) and D-loop (b) sequences表 2 基于Cytb(对角线下)和D-loop(对角线上)序列的叶尔羌高原鳅群体间遗传距离Table 2. Genetic distance between populations of T. yarkandensis based on Cytb (under the diagonal) and D-loop (on the diagonal) sequences analysis群体Population AKT DWQ JDT SWS TTM TKX WSX WWC AKT 0.0106 0.0092 0.0102 0.0105 0.0121 0.0105 0.0095 DWQ 0.0061 0.0110 0.0114 0.0116 0.0117 0.0113 0.0111 JDT 0.0056 0.0059 0.0103 0.0108 0.0125 0.0107 0.0095 SWS 0.0063 0.0065 0.0060 0.0106 0.0122 0.0110 0.0107 TTM 0.0067 0.0071 0.0065 0.0068 0.0118 0.0111 0.0116 TKX 0.0065 0.0058 0.0063 0.0065 0.0068 0.0120 0.0128 WSX 0.0063 0.0064 0.0060 0.0065 0.0069 0.0063 0.0110 WWC 0.0060 0.0062 0.0055 0.0064 0.0070 0.0066 0.0064 AMOVA分析结果显示, 基于Cytb和D-loop序列获得的群体内变异贡献率分别为96.57%和95.25%, 而群体间的变异贡献率仅为3.43%和4.75%(表 3)。为了解支流间的遗传变异, 本研究将8个群体按支流分为两个亚群(渭干河亚群和车尔臣河亚群), AMOVA分析发现, 遗传变异依然主要来自群体内部(Cytb, 93.55%; D-loop, 92.65%), 而支流间(Cytb, 5.40%; D-loop, 4.71%)和支流内群体间(Cytb, 1.05%; D-loop, 2.64%)遗传变异较小。但是, 遗传分化指数分析结果显示, 两支流之间出现了一定程度的遗传分化(Cytb, Fct=0.0540, P<0.05; D-loop, Fct=0.0471, P<0.05; 表 3)。
表 3 基于Cytb和D-loop序列的叶尔羌高原鳅群体间AMOVA分析结果Table 3. AMOVA analysis results of inter-population based on Cytb and D-loop sequences变异来源
Source of variation基因
Gene自由度
df方差和
Sum of squares变异组成
Variance components变异百分比
Percentage of variation (%)遗传分化指数
Fst8个地理群体 群体间
Among populationsCytb 7 41.9220 0.1200 3.43 Fst=0.0343 D-loop 7 71.2270 0.2444 4.75 Fst=0.0476 群体内
Within PopulationCytb 166 564.7870 3.3820 96.57 D-loop 166 812.9000 4.8970 95.25 两支流 支流间
Among groupsCytb 1 16.6620 0.1951 5.40 Fct=0.0540 D-loop 1 23.7760 0.2490 4.71 Fct=0.0471 支流内群体间
Among populations within groupsCytb 6 25.2600 0.0381 1.05 Fsc=0.0111 D-loop 6 47.4510 0.1395 2.64 Fsc=0.0277 群体内
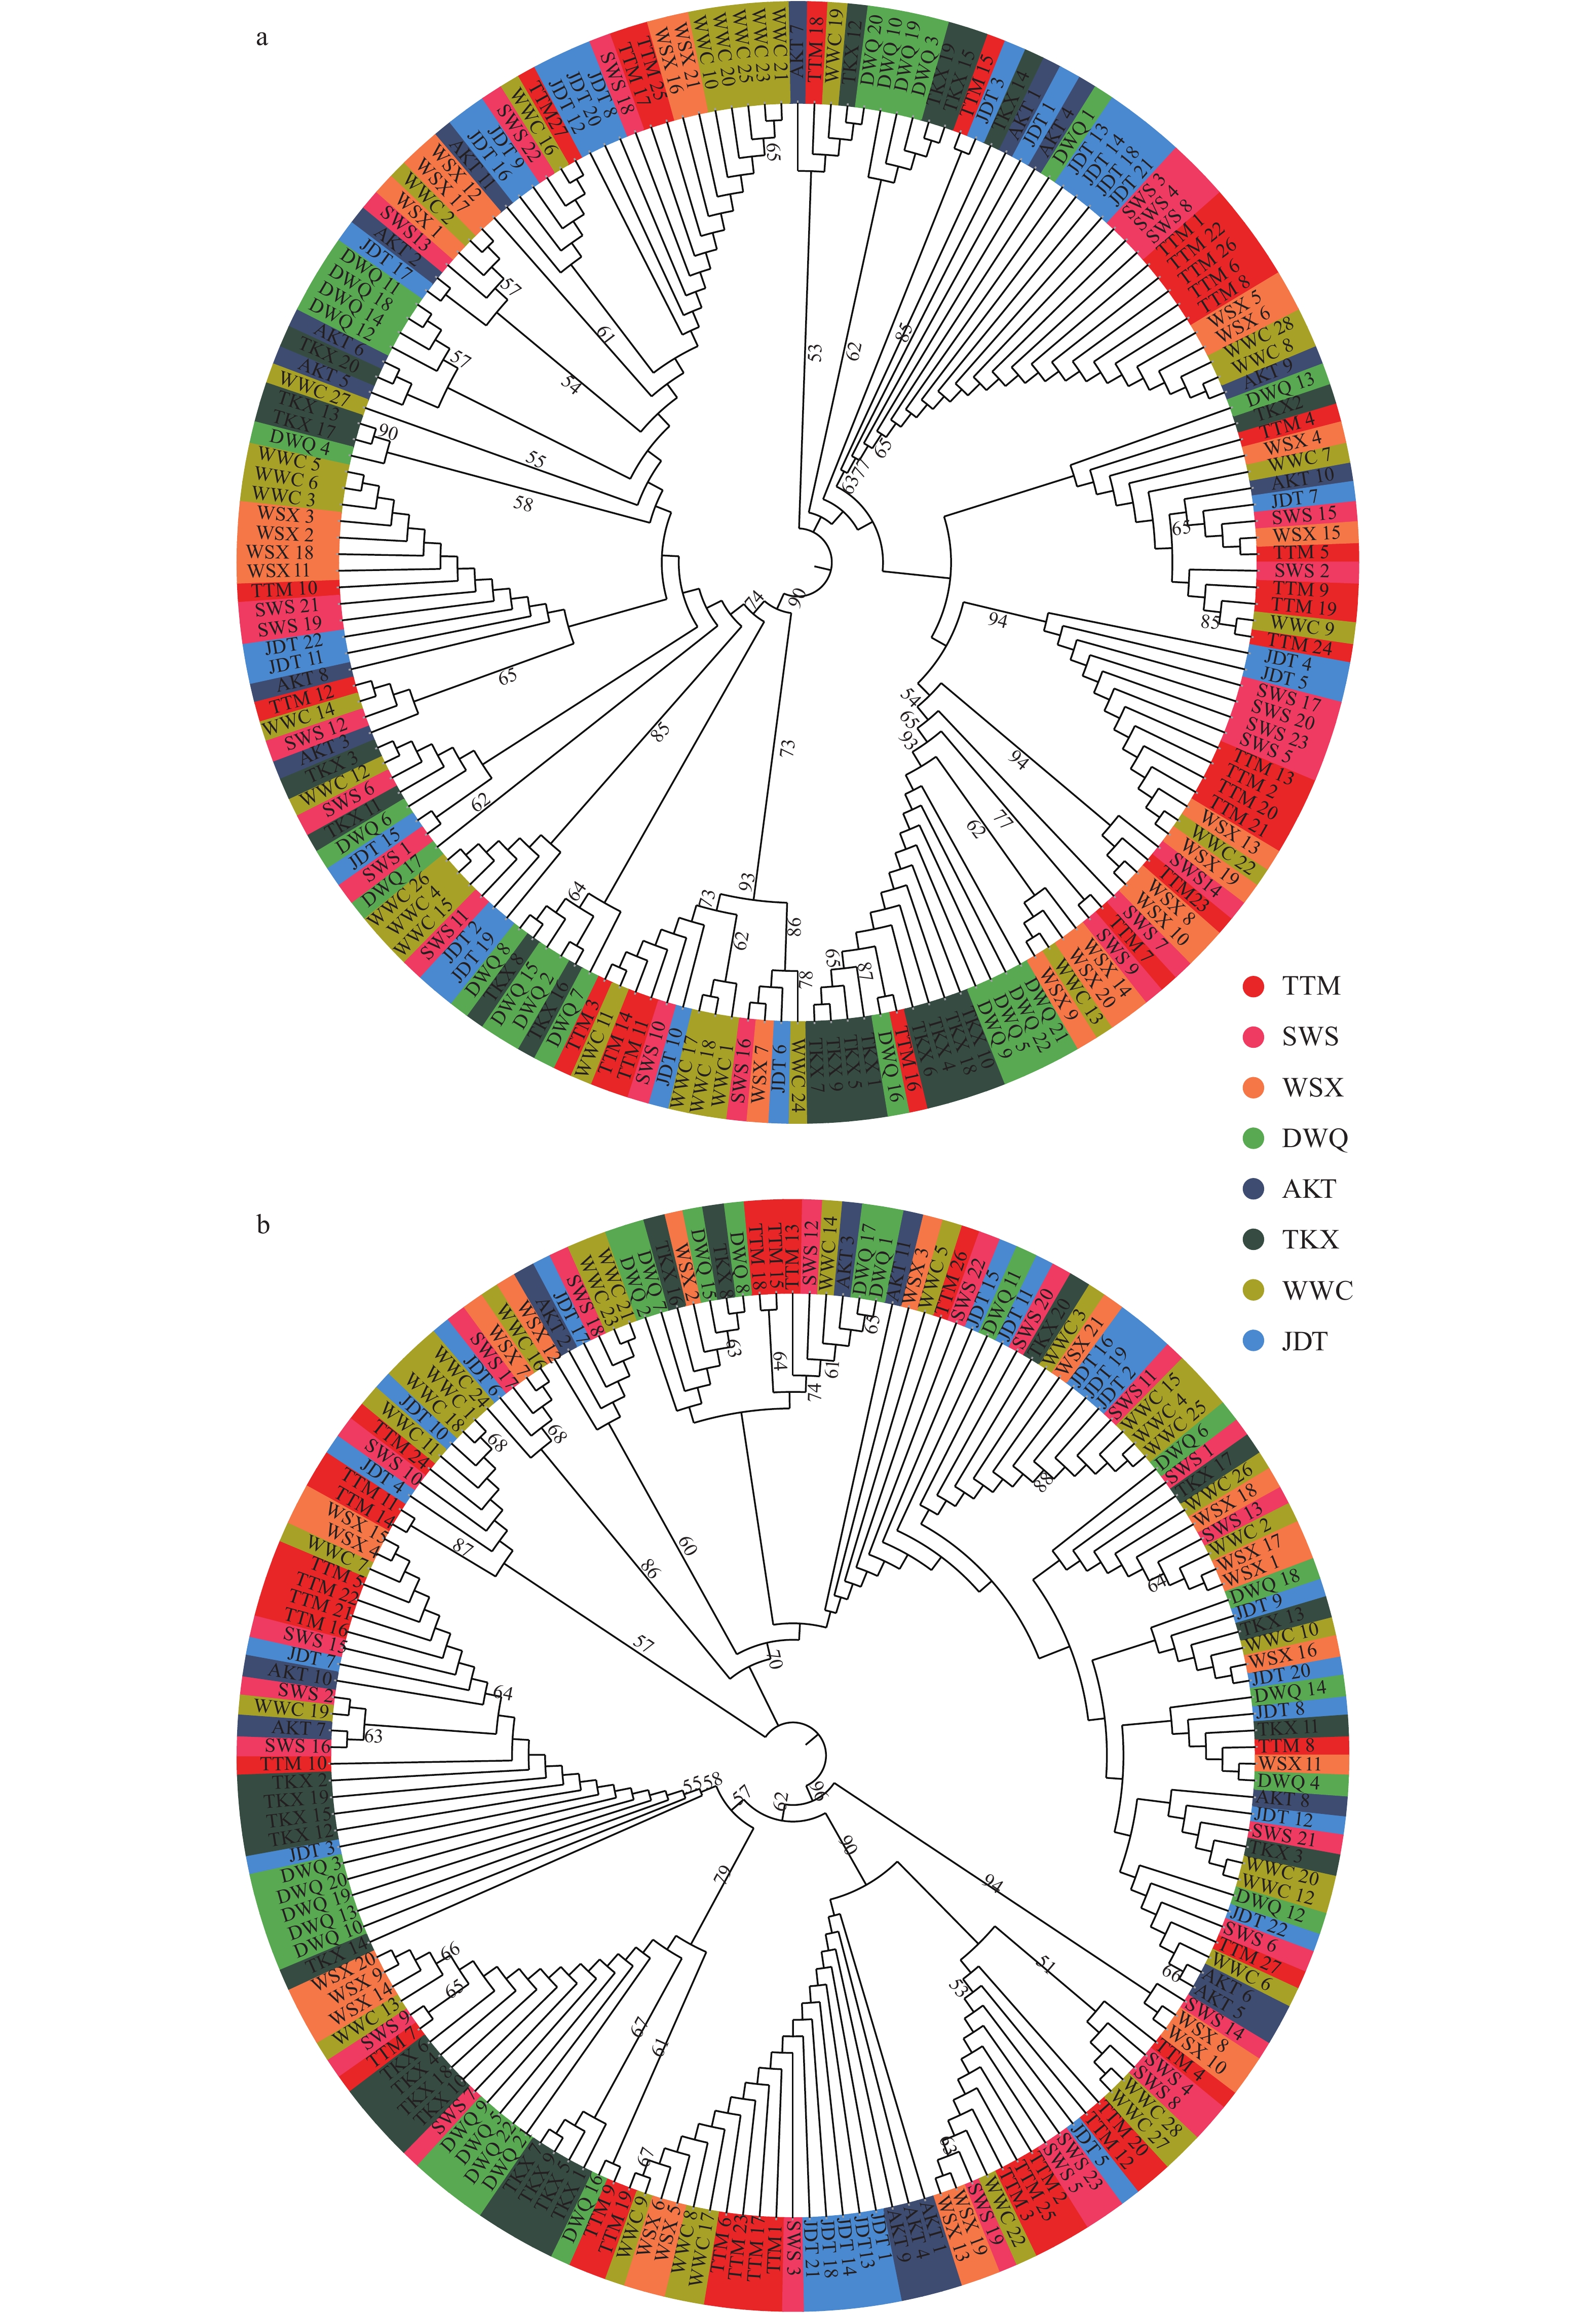
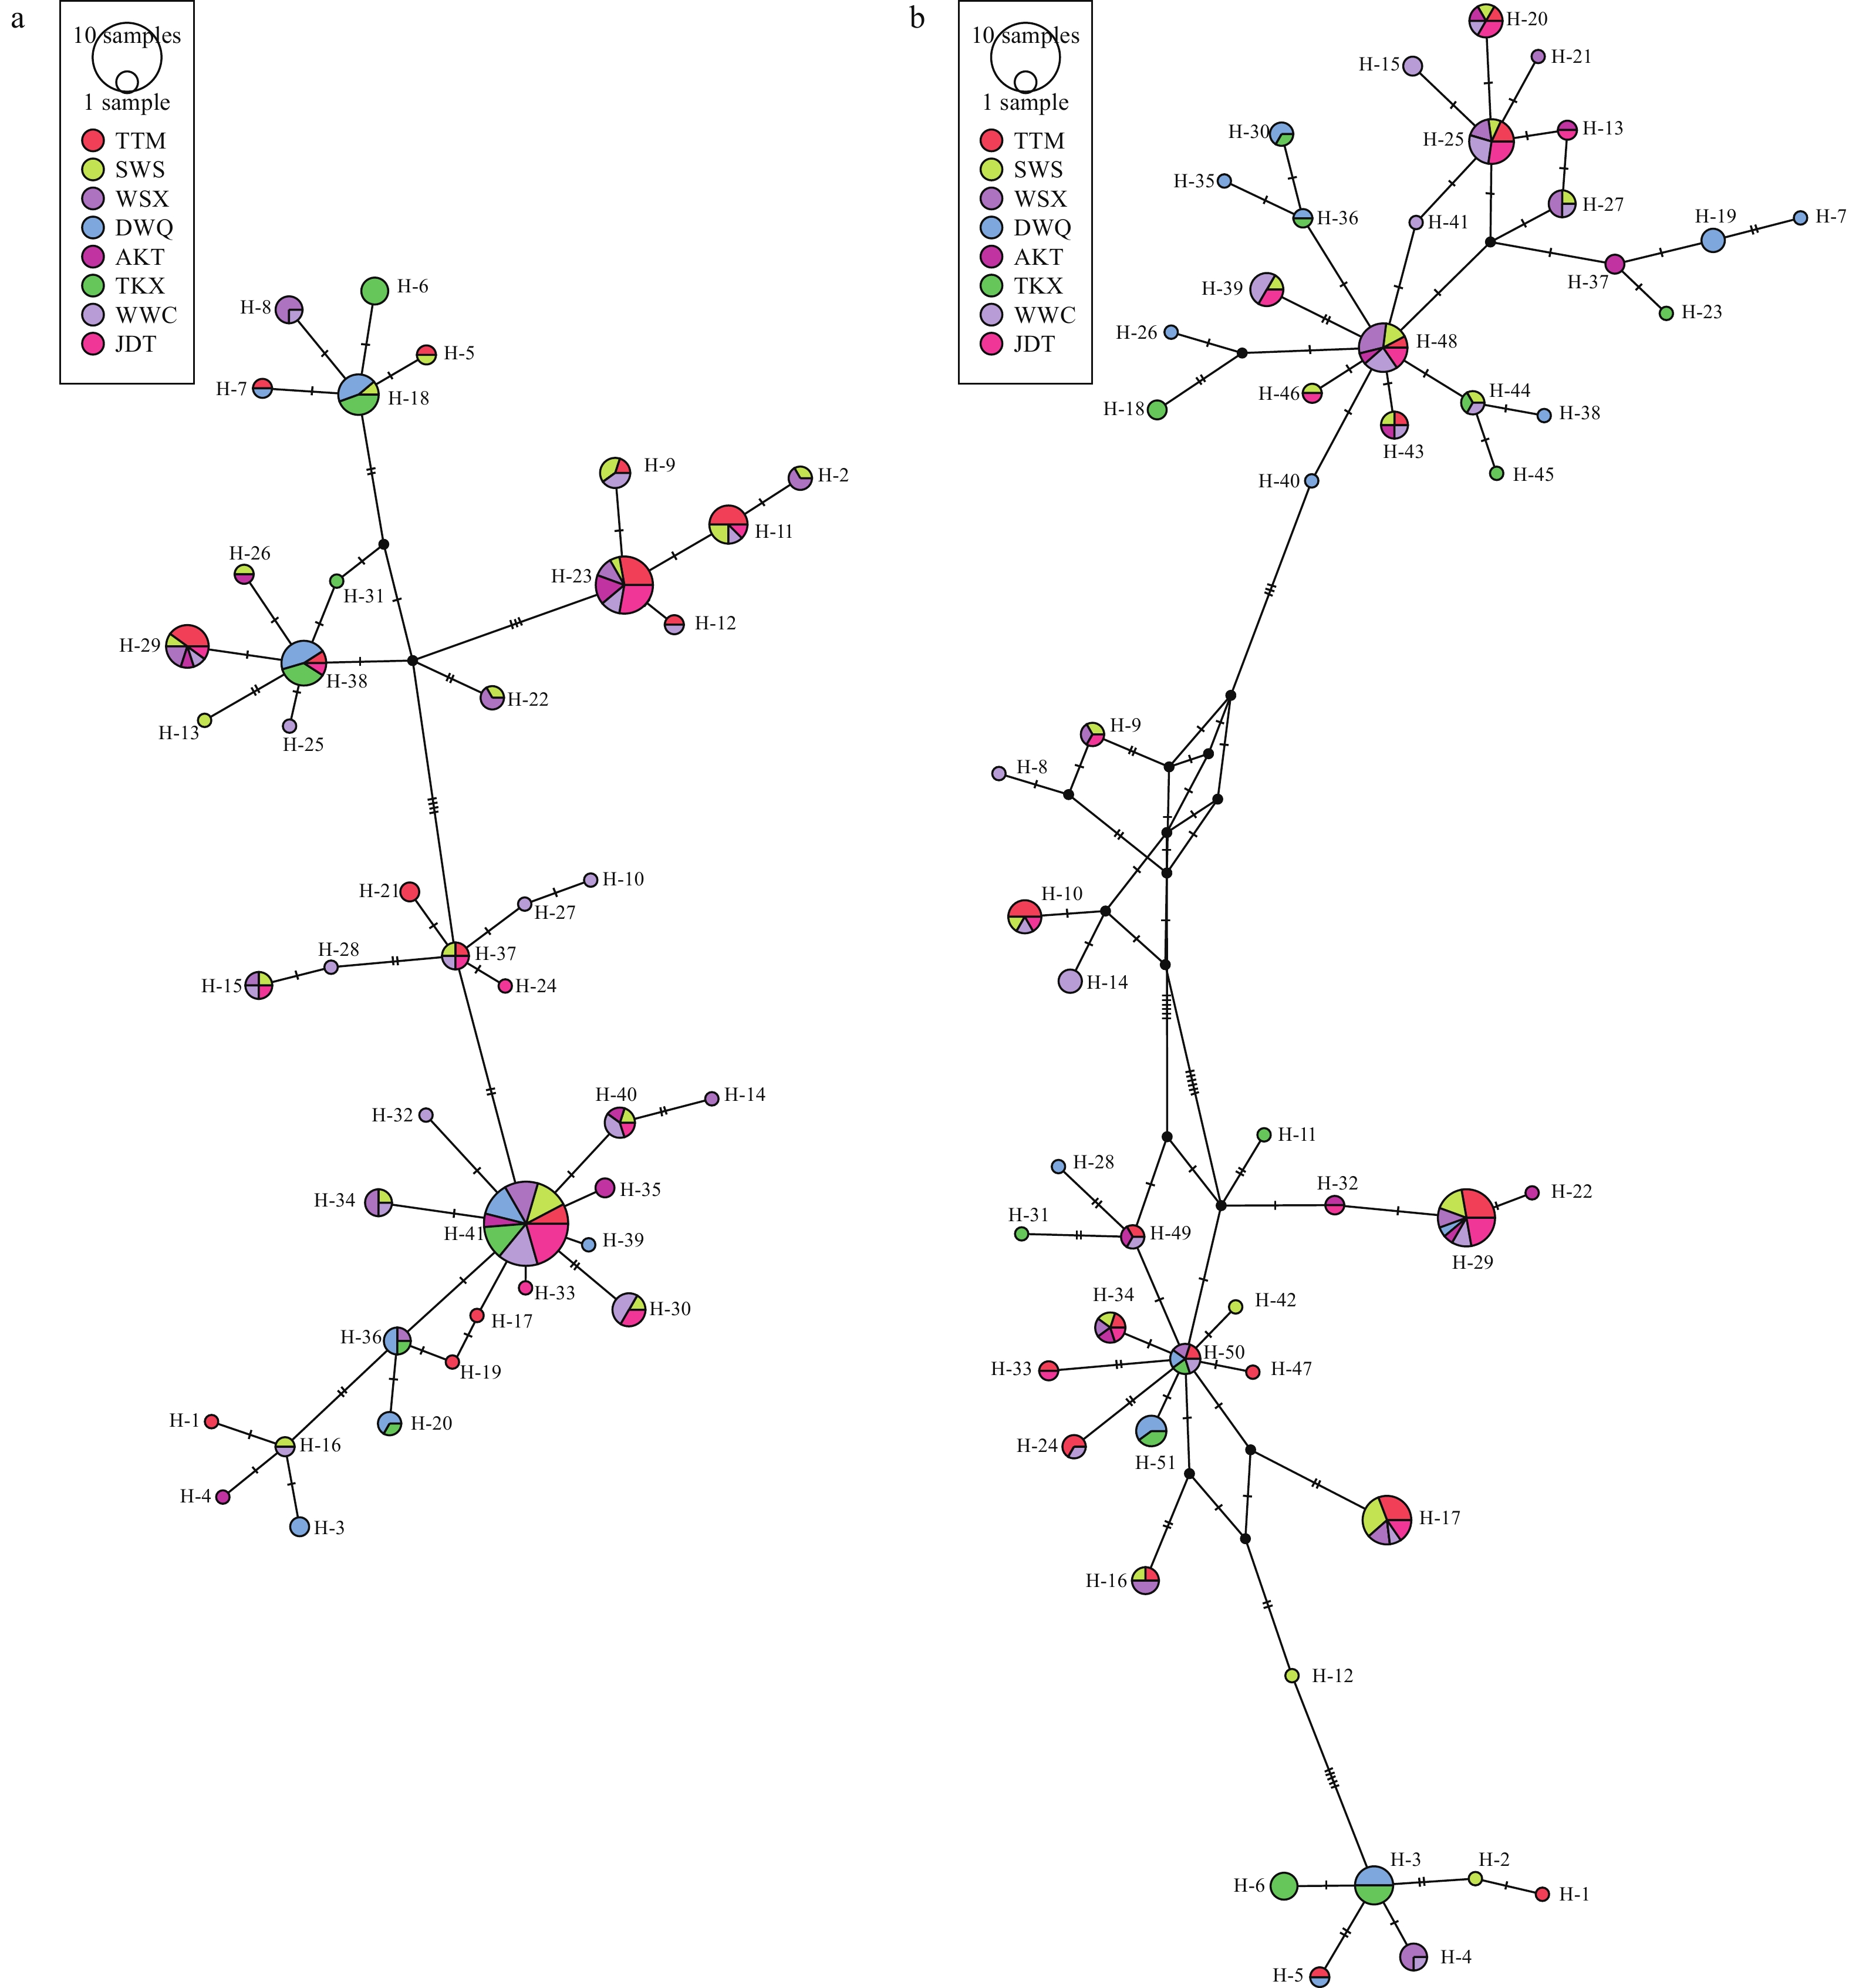
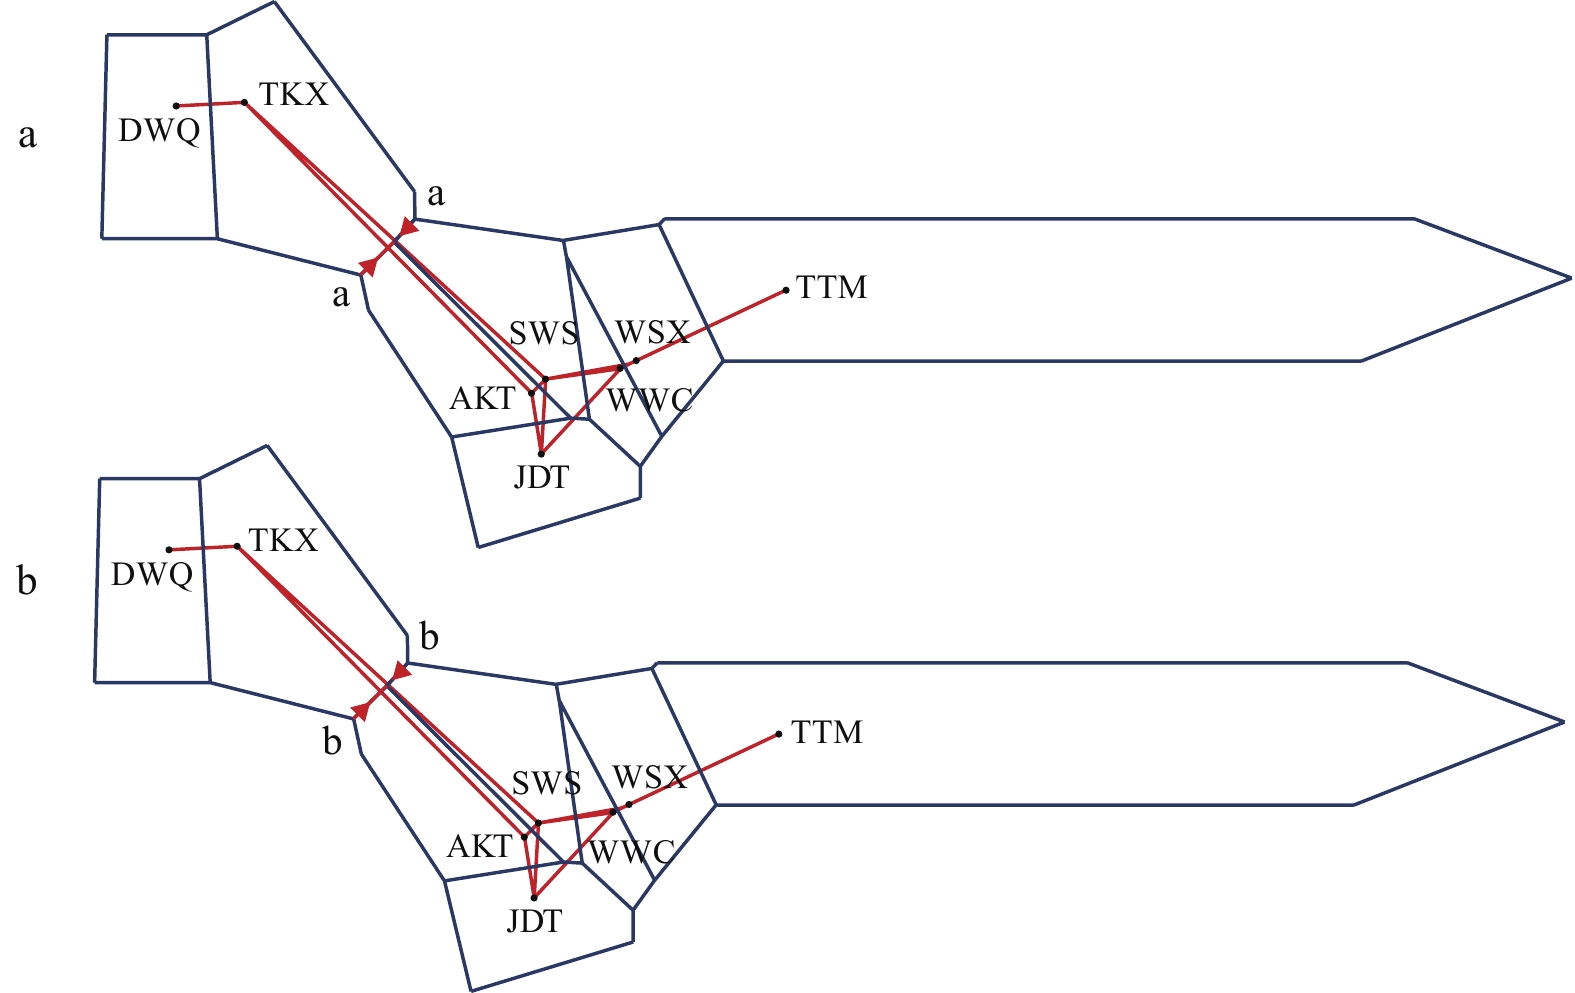
Within PopulationCytb 166 564.7870 3.3820 93.55 Fst=0.0645 D-loop 166 812.9000 4.8970 92.65 Fst=0.0735 注: 黑体表示显著性水平(P<0.05)Note: Boldface indicates significance (P<0.05) 基于各样本的Cytb和D-loop序列构建的NJ系统发育树显示, 8个群体的样本交错分布, 没能形成明显的地理聚类(图 4)。为了验证结果的准确性, 本研究进一步构建了单倍型网络进化图, 结果显示, 不同群体间共享单倍型较多, 也没能形成明显的地理聚群和谱系结构(图 5)。这与上述分析中各群体间遗传分化指数Fst值小、遗传距离值低的结果相一致。用BARRIER软件分析两支流的群体间是否存在遗传障碍, 基于Cytb和D-loop序列的分析结果一致, 均显示渭干河与车尔臣河群体之间存在潜在的遗传障碍(图 6)。
![]() 图 4 基于Cytb (a)和D-loop (b)序列构建的叶尔羌高原鳅各样本NJ系统发育树Figure 4. NJ phylogenetic trees of T. yarkandensis samples based on Cytb (a) and D-loop (b) sequences
图 4 基于Cytb (a)和D-loop (b)序列构建的叶尔羌高原鳅各样本NJ系统发育树Figure 4. NJ phylogenetic trees of T. yarkandensis samples based on Cytb (a) and D-loop (b) sequences![]() 图 5 基于Cytb (a)和D-loop (b)序列构建的叶尔羌高原鳅单倍型网络图Figure 5. Median-Joining network of Cytb (a) and D-loop (b) haplotypes from eight populations of T. yarkandensis
图 5 基于Cytb (a)和D-loop (b)序列构建的叶尔羌高原鳅单倍型网络图Figure 5. Median-Joining network of Cytb (a) and D-loop (b) haplotypes from eight populations of T. yarkandensis![]() 图 6 基于Cytb (a)和D-loop (b)遗传距离的遗传障碍图圆点表失8个叶尔羌高原鳅所在地理位置, 红色箭头a, b代表遗传障碍Figure 6. Map of genetic barriers based on Cytb (a) and D-loop (b) genetic distancesCircle points represent the locations of the eight T. yarkandensis labeled by abbreviations of their populations, the red arrows a and b represent genetic barriers
图 6 基于Cytb (a)和D-loop (b)遗传距离的遗传障碍图圆点表失8个叶尔羌高原鳅所在地理位置, 红色箭头a, b代表遗传障碍Figure 6. Map of genetic barriers based on Cytb (a) and D-loop (b) genetic distancesCircle points represent the locations of the eight T. yarkandensis labeled by abbreviations of their populations, the red arrows a and b represent genetic barriers2.4 群体历史动态信息
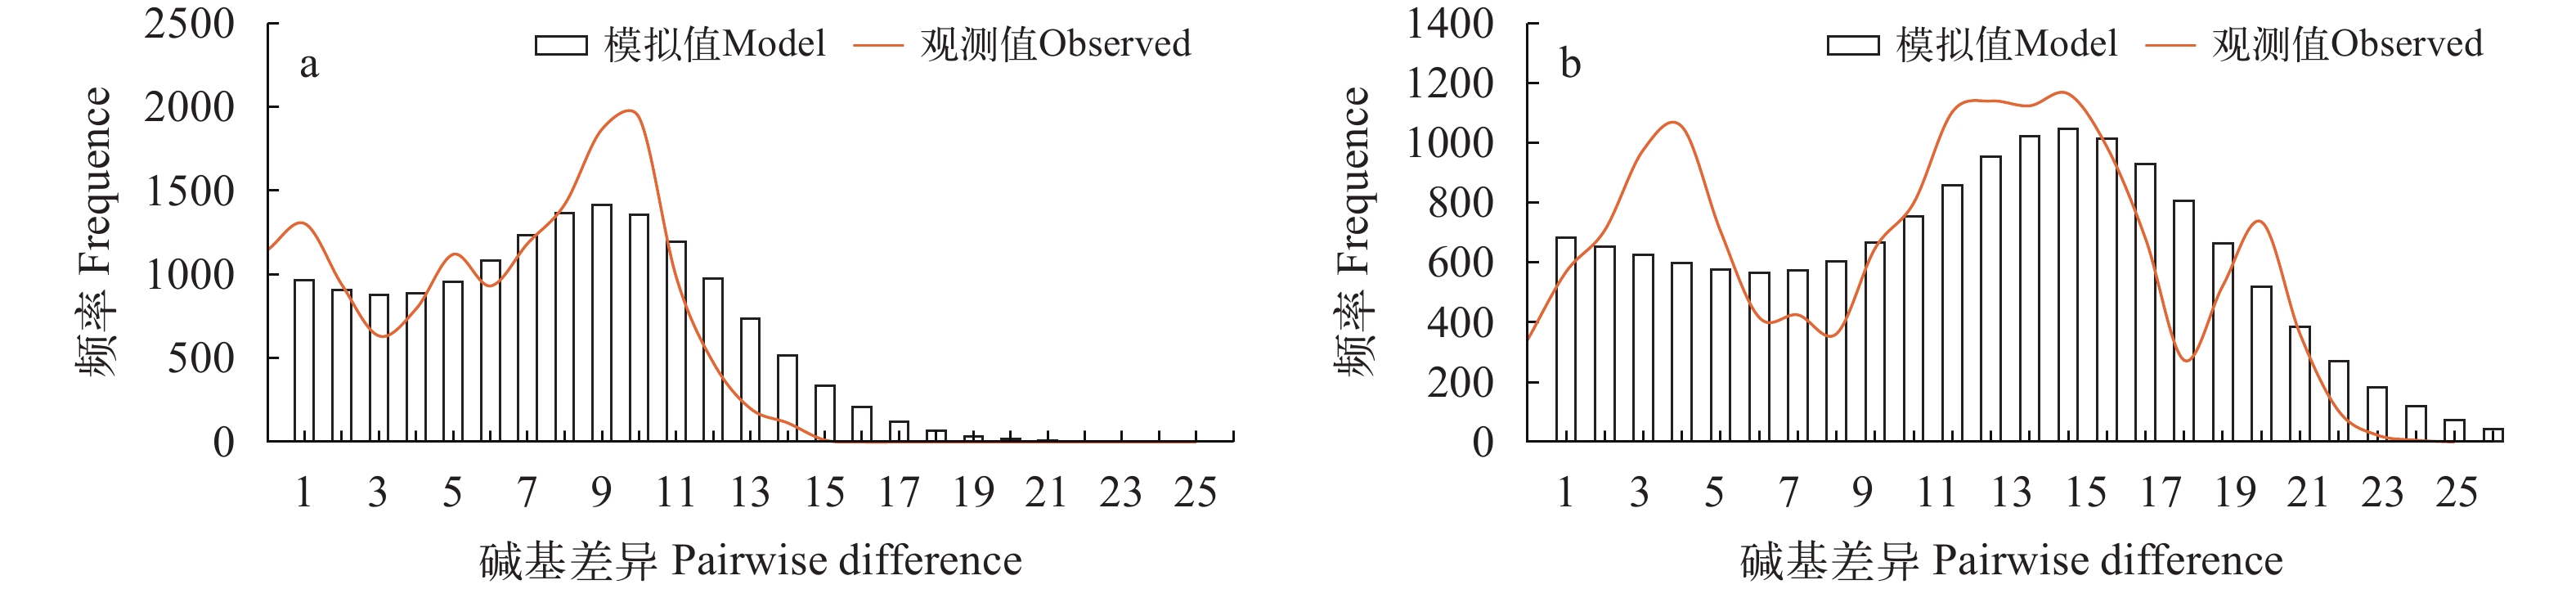
Tajima’s D和Fu’s Fs中性检验结果如表 4所示, 除SWS和WWC两个群体的Fs值为负值且统计学结果显著(P<0.05)外, 其他6个群体的D值和Fs值的统计学结果都不显著(P>0.05)。随后, 我们将所有个体作为一个整体进行Tajima’s D和Fu’s Fs检验, 得到的D值和Fs值均为负值, 但D值的统计学结果不显著(P>0.05), 结合大部分群体D值与Fs值都为正值且统计学不显著的结果, 说明没有明显偏离中性突变。此外, 虽然错配分析拟合度检验结果支持扩张假设(P>0.05; 表 4), 但是基于Cytb与D-loop所得核苷酸错配分布曲线都为多峰形(图 7a和7b)。综合数据结果表明, 整个叶尔羌高原鳅种群相对稳定, 近期没有经历过瓶颈效应和明显扩张。
表 4 叶尔羌高原鳅8个群体的中性检验及拟合度检验Table 4. Neutrality test and goodness-of-test for eight T. yarkandensis populations基因
Gene群体
PopulationTajima’s D test Fu’s Fs test 拟合度检验 D P Fs P 偏离方差SSD P 粗糙指数R P Cytb AKT 0.4738 0.7020 0.2678 0.5610 0.0577 0.1490 0.1114 0.2040 DWQ 0.9530 0.8440 1.6361 0.7980 0.0242 0.4410 0.0624 0.2350 JDT 0.1170 0.6120 –0.9321 0.3340 0.0256 0.4120 0.0443 0.5020 SWS –0.7584 0.2480 –5.7548 0.0150 0.0090 0.5830 0.0178 0.6820 TTM –0.1158 0.5010 0.0118 0.5340 0.0099 0.6390 0.0188 0.6700 TKX 1.7443 0.9700 1.9507 0.8220 0.0280 0.3790 0.0574 0.3870 WSX 0.0256 0.5670 0.4371 0.5910 0.0108 0.4330 0.0139 0.8620 WWC –0.8408 0.1970 –5.8045 0.0180 0.0135 0.5280 0.0249 0.6150 D-loop AKT 1.4729 0.9480 –1.9253 0.1450 0.0445 0.0810 0.0298 0.7790 DWQ 0.8198 0.8380 –0.9803 0.3470 0.0221 0.4940 0.0373 0.3680 JDT 0.8429 0.8560 –3.2211 0.0980 0.0135 0.5480 0.0228 0.7140 SWS –0.1615 0.4920 –4.7295 0.0340 0.0213 0.2310 0.0362 0.1910 TTM –0.4601 0.3590 –4.3597 0.0600 0.0213 0.2970 0.0364 0.2100 TKX 1.3431 0.9420 –0.7006 0.3790 0.0190 0.5410 0.0284 0.5940 WSX 0.4881 0.7350 0.2850 0.5550 0.0279 0.1740 0.0844 0.0400 WWC –0.2967 0.4050 –8.4706 0.0040 0.0124 0.6130 0.0178 0.6720 Cytb 总体 –0.8055 0.2150 –10.2915 0.0190 0.0065 0.5840 0.0087 0.7580 D-loop Total –0.1071 0.5460 –24.2266 0.0000 0.0046 0.7340 0.0051 0.8470 ![]() 图 7 基于Cytb (a)和D-loop (b)序列的叶尔羌高原鳅8个群体核苷酸错配分布图Figure 7. Mismatch distribution of eight T. yarkandensis populations based on Cytb (a) and D-loop (b) sequences
图 7 基于Cytb (a)和D-loop (b)序列的叶尔羌高原鳅8个群体核苷酸错配分布图Figure 7. Mismatch distribution of eight T. yarkandensis populations based on Cytb (a) and D-loop (b) sequences3. 讨论
3.1 序列组成及突变
本研究基于线粒体Cytb和D-loop序列对塔里木河支流渭干河和车尔臣河8个叶尔羌高原鳅群体的遗传多样性进行了分析。两序列的碱基组成分析发现, A+T含量均显著高于G+C含量, 呈现明显的偏随机分布, 这与多数脊椎动物线粒体基因的编码模式一致[29]。Meyer[30]提出, 在线粒体DNA进化过程中, 发生转换的频率远高于发生颠换的频率。叶尔羌高原鳅Cytb基因和D-loop序列的碱基转换与颠换比值分别为9.8﹕1和2.9﹕1, 表明两序列的碱基突变类型均以转换为主, 这与Meyer的结论一致[30]。
3.2 种群遗传多样性
遗传多样性是物种进化和适应环境变化的物质基础, 也是评价种群资源状况的重要依据, 一个物种的遗传多样性水平越高, 其对环境的适应能力就越强, 就能获得更多的生存空间使得种群得到更好的发展, 相反, 遗传多样性缺乏则会导致物种资源衰退甚至灭绝[31]。线粒体DNA的核苷酸多样性(Pi)和单倍型多样性(Hd)是评价物种群体遗传变异程度的重要指标, 也是衡量一个群体遗传多样性和遗传分化的重要参数[32]。Grant和Bowen[33]认为, 如果群体的核苷酸多样性指数Pi>0.05且单倍型多样性指数Hd>0.5, 则表明该群体的遗传变异较丰富, 遗传多样性也较高。在本研究中, 8个叶尔羌高原鳅群体的Pi指数均大于0.005、Hd指数均大于0.5, 因此均属于高核苷酸多样性、高单倍型多样性群体, 这与王锦秀等[15]用SSR标记对塔里木河5个群体的叶尔羌高原鳅的研究结果类似。塔里木河叶尔羌高原鳅较高的遗传多样性水平, 可能是由于其对环境的适应能力较强, 在水体发生汇流时能很好地进行迁移, 使得群体间能够进行基因交流, 进而促进了群体的遗传变异 [14-16]。此外, 基于D-loop序列获得的各群体单倍型数、单倍型多态性指数和核苷酸多态性指数均大于基于Cytb序列分析的结果, 这可能与D-loop区不编码蛋白质, 所受的选择压力小, 进化速率会更快等因素有关[34, 35], 这也与杜景豪等[8]在日本囊对虾和Guo等[9]在拉萨裸裂尻鱼中的研究结果一致。
3.3 群体遗传结构
遗传距离大小是衡量物种间或同一物种不同群体间亲缘关系远近的常用指标, 种群内的遗传距离通常小于10%, 大于6%的群体间会有明显的亚种或种的分化[36]。在本研究中, 8个群体间的遗传距离值均较低(Cytb, 0.0055—0.0071; D-loop, 0.0092—0.0128), 表明相互间的遗传距离较近。根据Wright[28]的遗传分化理论, 遗传分化指数Fst<0.05代表遗传分化水平较低, 在本研究中, 大部分群体间的遗传分化指数Fst都小于0.05, 因此为低分化水平。王锦秀等[15]用SSR分析塔里木河5个叶尔羌高原鳅群体的遗传结构发现, 其遗传距离在0.606—1.901, 明显高于本研究结果, 并且多数群体间的遗传分化指数在0.05—0.15, 达到中等程度的遗传分化。产生上述结果差异的原因, 一方面可能是由于线粒体DNA标记(Cytb和D-loop)与核DNA标记(SSR)的进化速率不同[37], 因此, 用两种类型的遗传标记对群体遗传结构解析时可能会出现一定的差异; 另一方面, 由于种群的遗传结构受地理隔离、生存环境、种群瓶颈和基因流等多种因素的影响, 在王锦秀等[15]的研究中, 其5个采样点分别位于不同的支流(阿尔干、台特玛湖、车尔臣河、阿克苏河和台南河), 相互之间的地理位置距离较远, 群体间的基因交流相对较少。此外, AMOVA分析发现, 遗传变异主要来源于群体内部, 而群体间遗传变异很小, 仅3.43%(Cytb)和4.75%(D-loop); 基于样本构建的系统发育树和单倍型构建的网络进化图均显示, 各群体的样本没能形成明显的地理聚群和谱系结构。综合上述结果表明, 本研究的8个叶尔羌高原鳅群体间存在基因交流。虽然渭干河和车尔臣河属于塔里木河中游和下游的不同支流, 但自2000年起, 塔里木河下游启动了生态输水工程[38], 这可能促进了渭干河和车尔臣河间的叶尔羌高原鳅的基因交流。王锦秀等[15]在其研究中也发现, 不同支流的叶尔羌高原鳅群体间存在基因交流, 并指出, 这种交流增加了群体的等位基因数, 是其群体遗传多样性高的原因之一。
3.4 群体历史动态
Tajima’s D与Fu’s Fs检验在检测群体是否发生扩张方面比较敏感, 当明显偏离中性突变时, D值与Fs值为显著负值, 表明发生过群体扩张事件[39]; 核苷酸错配分布曲线呈单峰时表明群体发生过扩张, 呈双峰或多峰形时表明群体未经历扩张, 而是保持相对稳定的状态[40]。本研究基于Cytb和D-Loop序列的分析结果显示, 大部分群体的D值与Fs值为正值且没有显著性差异(P>0.05), 因此不能拒绝中性突变, 即没有发生过群体扩张事件; 同时, 核苷酸错配分布曲线为双峰形。这些结果表明, 本研究中的8个叶尔羌高原鳅群体没有经历扩张, 而是保持着一个相对稳定的状态。
综上所述, 塔里木河叶尔羌高原鳅各群体的遗传多样性水平较高, 但遗传变异主要来源于群体内部, 群体间的遗传分化程度较小, 各样本没能形成明显的遗传分支与地理群体聚类。虽然两支流群体间存在潜在的遗传障碍, 并发生了一定的遗传分化, 但其遗传距离只在0.05附近(Cytb, Fct=0.0540; D-loop, Fct=0.0471)。因此, 根据进化上具有关键意义的单元ESU(Evolutionarily Significant Unit)设置原则[41], 本研究建议将塔里木河叶尔羌高原鳅种群作为一个保护管理单元进行保护。
-
![]()
图 2 叶尔羌高原鳅Cytb (a)与D-loop (b)序列的变异位点图
Figure 2. The genetic variation loci of T. yarkandensis in Cytb (a) and D-loop (b) sequences
![]()
图 3 基于Cytb(a)和D-loop(b)序列的群体间遗传分化指数(Fst)
Figure 3. Pairwise Fst between pairs of populations based on Cytb (a) and D-loop (b) sequences
![]()
图 4 基于Cytb (a)和D-loop (b)序列构建的叶尔羌高原鳅各样本NJ系统发育树
Figure 4. NJ phylogenetic trees of T. yarkandensis samples based on Cytb (a) and D-loop (b) sequences
![]()
图 5 基于Cytb (a)和D-loop (b)序列构建的叶尔羌高原鳅单倍型网络图
Figure 5. Median-Joining network of Cytb (a) and D-loop (b) haplotypes from eight populations of T. yarkandensis
![]()
图 6 基于Cytb (a)和D-loop (b)遗传距离的遗传障碍图
圆点表失8个叶尔羌高原鳅所在地理位置, 红色箭头a, b代表遗传障碍
Figure 6. Map of genetic barriers based on Cytb (a) and D-loop (b) genetic distances
Circle points represent the locations of the eight T. yarkandensis labeled by abbreviations of their populations, the red arrows a and b represent genetic barriers
![]()
图 7 基于Cytb (a)和D-loop (b)序列的叶尔羌高原鳅8个群体核苷酸错配分布图
Figure 7. Mismatch distribution of eight T. yarkandensis populations based on Cytb (a) and D-loop (b) sequences
表 1 叶尔羌高原鳅各群体的遗传多样性参数
Table 1 Genetic diversity parameters in each population of T. yarkandensis
基因Gene 群体Population 单倍型数H 单倍型多样性指数Hd 核苷酸多样性指数Pi 平均核苷酸差异数K Cytb AKT
DWQ
TKX
SWS
JDT
WSX
WWC
TTM7
8
7
17
11
10
18
140.9091±0.0656
0.8745±0.0374
0.8526±0.0394
0.9526±0.0335
0.8458±0.0589
0.9143±0.0364
0.9444±0.0295
0.9259±0.02740.0062±0.0036
0.0057±0.0032
0.0053±0.0030
0.0068±0.0037
0.0052±0.0029
0.0068±0.0037
0.0060±0.0033
0.0094±0.00496.4180
5.8790
5.3120
6.9490
5.3120
6.9950
6.1400
6.2790D-loop AKT
DWQ
TKX
SWS
JDT
WSX
WWC
TTM10
14
12
17
13
11
18
160.9818±0.0463
0.9437±0.0299
0.9263±0.0378
0.9605±0.0272
0.9437±0.0282
0.9333±0.0296
0.9630±0.0181
0.9402±0.02700.0097±0.0055
0.0119±0.0063
0.0121±0.0064
0.0114±0.0060
0.0106±0.0057
0.0119±0.0063
0.0100±0.0053
0.0107±0.00578.3820
9.9870
10.2370
9.6050
8.5340
10.0100
8.2720
8.7690Cytb
D-loop总体
Total41
510.9247±0.0124
0.9776±0.00320.0065±0.0034
0.0115±0.00586.3790
9.5820 下载: 导出CSV
表 2 基于Cytb(对角线下)和D-loop(对角线上)序列的叶尔羌高原鳅群体间遗传距离
Table 2 Genetic distance between populations of T. yarkandensis based on Cytb (under the diagonal) and D-loop (on the diagonal) sequences analysis
群体Population AKT DWQ JDT SWS TTM TKX WSX WWC AKT 0.0106 0.0092 0.0102 0.0105 0.0121 0.0105 0.0095 DWQ 0.0061 0.0110 0.0114 0.0116 0.0117 0.0113 0.0111 JDT 0.0056 0.0059 0.0103 0.0108 0.0125 0.0107 0.0095 SWS 0.0063 0.0065 0.0060 0.0106 0.0122 0.0110 0.0107 TTM 0.0067 0.0071 0.0065 0.0068 0.0118 0.0111 0.0116 TKX 0.0065 0.0058 0.0063 0.0065 0.0068 0.0120 0.0128 WSX 0.0063 0.0064 0.0060 0.0065 0.0069 0.0063 0.0110 WWC 0.0060 0.0062 0.0055 0.0064 0.0070 0.0066 0.0064
下载: 导出CSV
表 3 基于Cytb和D-loop序列的叶尔羌高原鳅群体间AMOVA分析结果
Table 3 AMOVA analysis results of inter-population based on Cytb and D-loop sequences
变异来源
Source of variation基因
Gene自由度
df方差和
Sum of squares变异组成
Variance components变异百分比
Percentage of variation (%)遗传分化指数
Fst8个地理群体 群体间
Among populationsCytb 7 41.9220 0.1200 3.43 Fst=0.0343 D-loop 7 71.2270 0.2444 4.75 Fst=0.0476 群体内
Within PopulationCytb 166 564.7870 3.3820 96.57 D-loop 166 812.9000 4.8970 95.25 两支流 支流间
Among groupsCytb 1 16.6620 0.1951 5.40 Fct=0.0540 D-loop 1 23.7760 0.2490 4.71 Fct=0.0471 支流内群体间
Among populations within groupsCytb 6 25.2600 0.0381 1.05 Fsc=0.0111 D-loop 6 47.4510 0.1395 2.64 Fsc=0.0277 群体内
Within PopulationCytb 166 564.7870 3.3820 93.55 Fst=0.0645 D-loop 166 812.9000 4.8970 92.65 Fst=0.0735 注: 黑体表示显著性水平(P<0.05)Note: Boldface indicates significance (P<0.05)
下载: 导出CSV
表 4 叶尔羌高原鳅8个群体的中性检验及拟合度检验
Table 4 Neutrality test and goodness-of-test for eight T. yarkandensis populations
基因
Gene群体
PopulationTajima’s D test Fu’s Fs test 拟合度检验 D P Fs P 偏离方差SSD P 粗糙指数R P Cytb AKT 0.4738 0.7020 0.2678 0.5610 0.0577 0.1490 0.1114 0.2040 DWQ 0.9530 0.8440 1.6361 0.7980 0.0242 0.4410 0.0624 0.2350 JDT 0.1170 0.6120 –0.9321 0.3340 0.0256 0.4120 0.0443 0.5020 SWS –0.7584 0.2480 –5.7548 0.0150 0.0090 0.5830 0.0178 0.6820 TTM –0.1158 0.5010 0.0118 0.5340 0.0099 0.6390 0.0188 0.6700 TKX 1.7443 0.9700 1.9507 0.8220 0.0280 0.3790 0.0574 0.3870 WSX 0.0256 0.5670 0.4371 0.5910 0.0108 0.4330 0.0139 0.8620 WWC –0.8408 0.1970 –5.8045 0.0180 0.0135 0.5280 0.0249 0.6150 D-loop AKT 1.4729 0.9480 –1.9253 0.1450 0.0445 0.0810 0.0298 0.7790 DWQ 0.8198 0.8380 –0.9803 0.3470 0.0221 0.4940 0.0373 0.3680 JDT 0.8429 0.8560 –3.2211 0.0980 0.0135 0.5480 0.0228 0.7140 SWS –0.1615 0.4920 –4.7295 0.0340 0.0213 0.2310 0.0362 0.1910 TTM –0.4601 0.3590 –4.3597 0.0600 0.0213 0.2970 0.0364 0.2100 TKX 1.3431 0.9420 –0.7006 0.3790 0.0190 0.5410 0.0284 0.5940 WSX 0.4881 0.7350 0.2850 0.5550 0.0279 0.1740 0.0844 0.0400 WWC –0.2967 0.4050 –8.4706 0.0040 0.0124 0.6130 0.0178 0.6720 Cytb 总体 –0.8055 0.2150 –10.2915 0.0190 0.0065 0.5840 0.0087 0.7580 D-loop Total –0.1071 0.5460 –24.2266 0.0000 0.0046 0.7340 0.0051 0.8470
下载: 导出CSV
-
[1] 陈生熬, 马春晖, 丁慧萍, 等. 塔里木河叶尔羌高原鳅繁殖生物学研究 [J]. 水生生物学报, 2013, 37(5): 810-816. doi: 10.7541/2013.103 Chen S A, Ma C H, Ding H P, et al. The reproductive biology of Triplophysa (Hedinichthys) yarkandensis (Day) in Tarim River [J]. Acta Hydrobiologica Sinica, 2013, 37(5): 810-816. doi: 10.7541/2013.103
[2] 马燕武, 郭焱, 张人铭, 等. 新疆塔里木河水系土著鱼类区系组成与分布 [J]. 水产学报, 2009, 33(6): 949-956. Ma Y W, Guo Y, Zhang R M, et al. Fauna composition and distribution of aboriginal fish in the Tarim River of Xinjiang Uygur Autonomous Region [J]. Journal of Fisheries of China, 2009, 33(6): 949-956.
[3] Gray M W, Burger G, Lang B F. Mitochondrial evolution [J]. Science, 1999, 283(5407): 1476-1481. doi: 10.1126/science.283.5407.1476
[4] 程起群, 马春艳, 庄平, 等. 基于线粒体Cyt b基因标记探讨凤鲚3群体遗传结构和进化特征 [J]. 水产学报, 2008, 32(1): 1-7. Cheng Q Q, Ma C Y, Zhuang P, et al. Genetic structure and evolution characters in three populations of Coilia mystus based on cytochrome b gene segment sequence of mitochondrial DNA [J]. Journal of Fisheries of China, 2008, 32(1): 1-7.
[5] 邓娟, 张红平, 巴贵, 等. 基于Cytb基因多态性研究西藏地区8个藏山羊群体遗传结构及母系起源 [J]. 畜牧兽医学报, 2018, 49(1): 65-74. doi: 10.11843/j.issn.0366-6964.2018.01.008 Deng J, Zhang H P, Ba G, et al. Genetic structure and maternal origins of 8 Tibetan goat populations in Tibet inferred from Cytb gene diversity [J]. Chinese Journal of Animal and Veterinary Sciences, 2018, 49(1): 65-74. doi: 10.11843/j.issn.0366-6964.2018.01.008
[6] 鲁翠云, 陈昕, 那荣滨, 等. 用Cytb基因分析松嫩平原区湖泊水库大银鱼的遗传多样性 [J]. 水产学杂志, 2020, 33(5): 1-6. doi: 10.3969/j.issn.1005-3832.2020.05.001 Lu C Y, Chen X, Na R B, et al. Genetic diversity of clearhead icefish (Protosalanx hyalocranius) in lakes and reservoirs of Songnen Plain by Cytb gene [J]. Chinese Journal of Fisheries, 2020, 33(5): 1-6. doi: 10.3969/j.issn.1005-3832.2020.05.001
[7] Muchadeyi F C, Eding H, Simianer H, et al. Mitochondrial DNA D-loop sequences suggest a Southeast Asian and Indian origin of zimbabwean village chickens [J]. Animal Genetics, 2008, 39(6): 615-622. doi: 10.1111/j.1365-2052.2008.01785.x
[8] 杜景豪, 王伟峰, 陈秀荔, 等. 基于Cytb和D-loop的日本囊对虾遗传多样性分析 [J]. 水产科学, 2020, 39(4): 524-531. Du J H, Wang W F, Chen X L, et al. Analysis of genetic diversity of Kuruma Prawn Marsupenaeus japonicus based on mitochondrial Cytb and D-loop sequences [J]. Fisheries Science, 2020, 39(4): 524-531.
[9] Guo S S, Zhang G R, Guo X Z, et al. Genetic diversity and population structure of Schizopygopsis younghusbandi Regan in the Yarlung Tsangpo River inferred from mitochondrial DNA sequence analysis [J]. Biochemical Systematics and Ecology, 2014(57): 141-151. doi: 10.1016/j.bse.2014.07.026
[10] 曾霖, 唐文乔. 叶尔羌高原鳅的年龄、生长与繁殖特征 [J]. 动物学杂志, 2010, 45(5): 29-38. Zeng L, Tang W Q. Age, body growth and reproductive characteristics of Triplophysa yarkandensis [J]. Chinese Journal of Zoology, 2010, 45(5): 29-38.
[11] 陈生熬, 姚娜. 塔里木河流域叶尔羌高原鳅的生物学调查 [J]. 水生态学杂志, 2008, 1(5): 100-102. Chen S A, Yao N. Research on biological characteristic of the Triplophysa (Hedinichthys) yarkandensis (Day) in Tarim River [J]. Journal of Hydroecology, 2008, 1(5): 100-102.
[12] 陈生熬, 姚娜, 任道全, 等. 塔里木河上游叶尔羌高原鳅种群结构研究 [J]. 东北农业大学学报., 2014, 45(8): 90-97. Chen S A, Yao N, Ren D Q, et al. Study on the population structure of Triplophysa (Hedinichthys) yarkandensis (Day) in the upper reaches of Tarim River [J]. Journal of Northeast Agricultural University, 2014, 45(8): 90-97.
[13] 王帅, 陈生熬, 宋勇, 等. 塔里木河流域叶尔羌高原鳅营养成分分析 [J]. 水生态学杂志, 2011, 32(1): 137-141. Wang S, Chen S A, Song Y, et al. Analysis of nutritional composition the Triplophysa (Hedinichthys) yarkandensis (Day) about Tarim River [J]. Journal of Hydroecology, 2011, 32(1): 137-141.
[14] 姚娜, 宋勇, 王帅, 等. 盐度和碱度对塔里木河叶尔羌高原鳅毒性的研究 [J]. 西南农业学报, 2018, 31(2): 423-428. Yao N, Song Y, Wang S, et al. Toxicity of salinity and alkalinity to Triplophysa (Hedinichthys) yarkandensis (Day) of Tarim River [J]. Southwest China Journal of Agricultural Sciences, 2018, 31(2): 423-428.
[15] 王锦秀, 任道全, 王新月, 等. 塔里木河流域5个地理种群的叶尔羌高原鳅遗传多样性分析 [J]. 渔业科学进展, 2021, 42(4): 46-54. Wang J X, Ren D Q, Wang X Y, et al. The analysis of genetic diversity of Triplophysa yarkandensis (Day) from five geographic populations in the Tarim River basin [J]. Progress in Fishery Sciences, 2021, 42(4): 46-54.
[16] 陈生熬, 姚娜, 江春雨, 等. 塔里木河叶尔羌高原鳅盐碱耐受性研究 [J]. 四川动物, 2016, 35(4): 523-527. doi: 10.11984/j.issn.1000-7083.20150307 Chen S A, Yao N, Jiang C Y, et al. Studies on the tolerance of Triplophysa (Hedinichthys) yarkandensis (Day) to salinity and alkalinity [J]. Sichuan Journal of Zoology, 2016, 35(4): 523-527. doi: 10.11984/j.issn.1000-7083.20150307
[17] Li Y, Wang W, Liu X, et al. DNA extraction from crayfish exoskeleton [J]. Indian Journal of Experimental Biology, 2011, 49(12): 953-957.
[18] Xiao W, Zhang Y, Liu H. Molecular systematics of Xenocyprinae (Teleostei: Cyprinidae): taxonomy, biogeography, and coevolution of a special group restricted in East Asia [J]. Molecular Phylogenetics and Evolution, 2001, 18(2): 163-173. doi: 10.1006/mpev.2000.0879
[19] Liu H, Tzeng C S, Teng H Y. Sequence variations in the mitochondrial DNA control region and their implications for the phylogeny of the Cypriniformes [J]. Canadian Journal of Zoology, 2002, 80(3): 569-581. doi: 10.1139/z02-035
[20] Hall T A. BioEdit: a user-friendly biological sequence alignment editor and analysis program for windows 95/98/NT [J]. Nucleic Acids Symposium Series, 1999, 41(41): 95-98.
[21] Sudhir K, Glen S, Koichiro T. MEGA7: Molecular evolutionary genetics analysis version 7.0 for bigger datasets [J]. Molecular Biology and Evolution, 2016, 33(7): 1870-1874. doi: 10.1093/molbev/msw054
[22] Leigh J W, Bryant D. PopART: full-feature software for haplotype network construction [J]. Methods in Ecology and Evolution, 2015, 6(9): 1110-1116. doi: 10.1111/2041-210X.12410
[23] Manni F, Guerard E, Heyer E. Geographic patterns of (genetic, morphologic, linguistic) variation: how barriers can be detected by using Monmonier’s Algorithm [J]. Human Biology, 2004, 76(2): 173-190. doi: 10.1353/hub.2004.0034
[24] Librado P, Rozas J. DnaSP v5: a software for comprehensive analysis of DNA polymorphism data [J]. Bioinformatics, 2009, 25(11): 1451-1452. doi: 10.1093/bioinformatics/btp187
[25] Excoffier L, Laval G, Schneider S. Arlequin (version 3.0): an integrated software package for population genetics data analysis [J]. Evolutionary Bioinformatics Online, 2007, 23(1): 47-50.
[26] Tajima F. Statistical method for testing the neutral mutation hypothesis by DNA polymorphism [J]. Genetics, 1989, 123(3): 585-595. doi: 10.1093/genetics/123.3.585
[27] Fu Y X. Statistical tests of neutrality of mutations against population growth, hitchhiking and background selection [J]. Genetics, 1997, 147(2): 915-925. doi: 10.1093/genetics/147.2.915
[28] Wright S. Evolution in Mendelian populations [J]. Bulletin of Mathematical Biology, 1990, 52(1-2): 241-295. doi: 10.1007/BF02459575
[29] Mayfield J E, McKenna J F. A-T rich sequences in vertebrate DNA. A possible explanation of q-banding in metaphase chromosomes [J]. Chromosoma, 1978, 67(2): 157-163. doi: 10.1007/BF00293173
[30] Meyer A. Evolution of Mitochondrial DNA in Fishes. ln: Biochemistry and Molecular Biology of Fishes [M]. Elsevier press, Amsterdam, the Netherlands, 1993: 1-36.
[31] Meyer A. Evolution of mitochondrial DNA in fishes [M]//Hochachka P W, Mommsen T P (Eds.), Biochemistry and Molecular Biology of Fishes. Amsterdam: Elsevier, 1993: 1-38.
[32] 闫华超, 高岚, 付崇罗, 等. 鱼类遗传多样性研究的分子学方法及应用进展 [J]. 水产科学, 2004, 23(12): 44-48. doi: 10.3969/j.issn.1003-1111.2004.12.015 Yan H C, Gao L, Fu C L, et al. Molecular methods and advances on genetic diversity evaluation in fish [J]. Fisheries Science, 2004, 23(12): 44-48. doi: 10.3969/j.issn.1003-1111.2004.12.015
[33] 陈骁, 杨圣云, 潘聪. 我国南部海域条纹斑竹鲨线粒体DNA控制区遗传多态性研究 [J]. 海洋学报, 2008, 30(6): 115-121. Chen X, Yang S Y, Pan C. Genetic polymorphism of mitochondrial control region in Chiloscyllium plagiosum from coastal waters of southern China [J]. Acta Oceanologica Sinica, 2008, 30(6): 115-121.
[34] Grant W S, Bowen B W. Shallow population histories in deep evolutionary lineages of marine fishes: insights from sardines and anchovies and lessons for conservation [J]. Journal of Heredity, 1998, 89(5): 415-426. doi: 10.1093/jhered/89.5.415
[35] Goos H. Biochemistry and molecular biology of fishes vol. 3: Analytical techniques [J]. Aquaculture, 1996, 140(4): 383-384.
[36] 肖武汉, 张亚平. 鱼类线粒体DNA的遗传与进化 [J]. 水生生物学报, 2000, 24(4): 384-391. doi: 10.3321/j.issn:1000-3207.2000.04.014 Xiao W H, Zhang Y P. Genetics and evolution of mitochondrial DNA in fish [J]. Acta Hydrobiologica Sinica, 2000, 24(4): 384-391. doi: 10.3321/j.issn:1000-3207.2000.04.014
[37] Billington N, Hebert P D N. Mitochondrial DNA diversity in fishes and its implications for introductions [J]. Canadian Journal of Fisheries and Aquatic Sciences, 1991, 48(S1): 80-94. doi: 10.1139/f91-306
[38] Wallace D C. Structure and evolution of organelle genomes [J]. Microbiological Reviews, 1982, 46(2): 208-240. doi: 10.1128/mr.46.2.208-240.1982
[39] 陈亚宁, 李卫红, 陈亚鹏, 等. 新疆塔里木河下游断流河道输水与生态恢复 [J]. 生态学报, 2007, 27(2): 538-545. doi: 10.3321/j.issn:1000-0933.2007.02.015 Chen Y N, Li W H, Chen Y P, et al. Water conveyance in dried-up riverway and ecological restoration in the lower reaches of Tarim River, China [J]. Acta Ecologica Sinica, 2007, 27(2): 538-545. doi: 10.3321/j.issn:1000-0933.2007.02.015
[40] Mondal D, Dutta S, Mallik A, et al. Mitochondrial DNA diversity: insight into population diversity, structure and demographic history of Penaeus monodon along the entire coastal region of India [J]. Aquaculture Research, 2020, 51(11): 4649-4680. doi: 10.1111/are.14812
[41] Rogers A R, Harpending H. Population growth makes waves in the distribution of pairwise genetic differences [J]. Molecular Biology and Evolution, 1992, 9(3): 552-569.
[42] Moritz C. Defining ‘evolutionarily significant units’ for conservation [J]. Trends in Ecology & Evolution, 1994, 9(10): 373-375.
-
期刊类型引用(9)
1. 刘士力,陈大伟,朱鹏灿,郑建波,夏冯博,程顺,蒋文枰,迟美丽,杭小英,李飞. 基于线粒体Cyt b基因序列的4个黄尾鲴养殖群体遗传多样性分析. 江苏农业学报. 2024(02): 342-347 .  百度学术
百度学术
2. 陈敏,秦媛,林业宏,任思齐,叶嘉政,郑善坚. 基于COI基因的浙江省内黄缘闭壳龟遗传多样性研究. 野生动物学报. 2024(02): 367-377 . 百度学术
3. 胡西庚,崔韵文,黎明政,谢碧文,张富铁. 基于cyt b基因序列的花斑副沙鳅种群遗传多样性比较研究. 四川动物. 2024(03): 241-250 . 百度学术
4. 胡令辉,葛建民,王新月,王程欣,梁本彬,宋勇,李正伟,陈生熬. 叶尔羌高原鳅形态性状对性腺重的影响分析. 水产学杂志. 2024(05): 37-44 . 百度学术
5. 孙志鹏,鲁翠云,那荣滨,郑先虎. 利用线粒体序列比较分析梭鲈鸭绿江和乌伦古湖群体的遗传结构. 水产学杂志. 2023(05): 10-16+26 . 百度学术
6. 葛建民,张永杰,王新月,彭冬升,胡令辉,宋勇,陈生熬. 投喂策略和光照强度对叶尔羌高原鳅幼鱼生长的影响. 塔里木大学学报. 2023(04): 97-104 . 百度学术
7. 杨晓鸽,夏美琪,姜洁晨,汪健,陈娜,廖梦绮,连玉喜. 基于线粒体Cyt b基因和D-loop区序列的长麦穗鱼遗传多样性研究. 中国水产科学. 2023(08): 1031-1041 . 百度学术
8. 刘士力,陈大伟,郑建波,程顺,蒋文枰,迟美丽,夏冯博,李飞. 基于线粒体D-loop区序列的4个黄尾鲴养殖群体遗传多样性分析. 广东农业科学. 2023(11): 139-145 . 百度学术
9. 刘乙蒙,刘洋,刘必林,俞晔伟,宋成辉,王丛丛. Cyt b和12S rRNA基因条形码在灯笼鱼科鱼类物种鉴定中的应用. 中国水产科学. 2023(09): 1112-1126 . 百度学术
其他类型引用(5)
计量
- 文章访问数: 2651
- HTML全文浏览量: 555
- PDF下载量: 103
- 被引次数: 14