
COMPARATIVE TRANSCRIPTOMIC ANALYSIS OF BRAIN AND SPLEEN IN TRIM47 KNOCKOUT ZEBRAFISH (DANIO RERIO)
-
Abstract: Tripartite motif (TRIM) proteins is a structurally conserved protein group that plays an important role in many biological processes, such as apoptosis, cycle regulation, cellular responses to viruses and inflammatory response. Trim47 is a member of the TRIM family. In this study, the CRISPR/Cas9 technique was employed to knockout trim47 of zebrafish. Brain and spleen of TRIM47–/–(trim47 knockout) and WT (wildtype) zebrafish were collected for RNA-seq analysis to identify differentially expressed genes (DEGs). A total of 271 DEGs were identified. After a brief analysis, these DEGs were annotated into Kyoto Encyclopedia of Genes and Genomes (KEGG) pathway and three ontologies following gene ontology (GO) enrichment analysis. DEGs were more concentrated in cell adhesion and glutamatergic synapse signaling pathway in brain of TRIM47–/– group as compared with WT group. In spleen, DEGs of TRIM47–/– group changed in complement and coagulation cascades signaling pathway as compared with WT group. The complement pathway-associated genes in brain and spleen were verified using qRT-PCR, which were consistent with the transcriptome data. These results indicated that Trim47 played an important biological role in spleen and brain, particularly involved in innate immune function through complement pathway. In vivo infection experiments showed that trim47 knockout increased the infection rate of Spring Viremia of Carp Virus (SVCV) in zebrafish. In conclusion, these findings provided new insight into the function of the TRIM members in innate immunity.摘要: 用CRISPR/Cas9技术敲除斑马鱼(Danio Rerio)的trim47, 收集TRIM47–/–(trim47基因敲除)和WT(野生型)斑马鱼的大脑和脾脏进行RNA-seq分析, 以鉴定差异表达基因(DEGs)。总共确定了271个DEGs, 经过简要分析, 将这些DEGs注释为KEGG途径和GO富集分析, 与WT组相比, TRIM47-/-组的脑中DEGs集中在细胞黏附和谷氨酸能突触信号传导途径中。在脾脏中, 与野生型组相比, TRIM47-/-组的DEGs在补体和凝血级联信号通路中发生了变化。使用qRT-PCR验证了脑和脾中与补体途径相关的基因, 与转录组数据一致。这些结果表明, Trim47在脾脏和大脑中起着重要的生物学作用, 尤其是通过补体途径参与先天免疫功能。体内感染实验表明, trim47基因敲除可提高斑马鱼中鲤春病毒血症病毒(SVCV)的感染率。总之, 这些发现为TRIM成员在先天免疫中的功能提供了新线索。
-
The members of the TRIM family were reported to play many important roles involved in many cellular processes, such as developmental courses, tumor suppression, cell cycle regulation and viral response[1]. In mammals, most TRIM members are associated with cancer. TRIM50 is known to inhibit ovarian cancer progression by targeting Src and reducing its activity, which provides a novel therapeutic strategy for Src over-activated cancers by positive regulation of TRIM50[2]. TRIM31 was reported to promote glioma proliferation and invasion through activating NF-κB activity[3]. Some TRIM members were also reported to have antiviral effect in fish. Grouper TRIM8, TRIM32 and TRIM39 have been identified as antiviral effectors against DNA and RNA viruses[4]. In common carp, TRIM32 was described as antiviral effectors and inducers of type I-IFN response, interfering with SVCV replication in vitro[5]. Tripartite motif 47 is a member of the TRIM family proteins and increased TRIM47 expression is a negative prognostic predictor in human prostate cancer[6]. Common carp TRIM47 was identified to play an important role in viral resistance processes[7]. Most experimental studies on TRIM molecules remain in vitro cell with few attention paid to in vivo experimental test, especially in fish.
The complement system known as an important part of the body’s innate immune response plays an irreplaceable role in host defense against pathogenic microorganisms and serves as a bridge between the innate and acquired immune responses[8]. The complement system is composed of more than 30 soluble and membrane-bound proteins. These proteins interact to form a complement cascade reaction[9]. There are three different pathways of complement activation: the classical pathway, the MB-lectin pathway and the alternative pathway. The complement system can be activated through “hard-wired” pattern recognition receptors that have been developed to recognize pathogenassociated molecular patterns (PAMPs)[8, 10, 11].
In recent years, CRISPR (Clustered Regularly Interspaced Short Palindromic Repeat)/Cas9 (CRISPR-associated) genome editing systems have become one of the most robust platforms in basic biomedical research and therapeutic applications[12]. Recent studies have shown that the RNA-mediated Cas9 system can mediate genome editing of embryonic cells of the trophozoites, zebrafish, mice, rats, barley, pigs and goats[13-17]. Because of simple manufacturing, low cost, direct cellular target, and high efficiency (it can transmit multiple sgRNAs at the same time)[14], CRISPR-CAS technology has made gene editing more efficient and more conducive to examine the function of target genes.
In this study, the CRISPR/Cas9 technique was employed and homozygous selection was performed to construct TRIM47–/– zebrafish. The brain and spleen from the TRIM47–/– group and WT group zebrafish were selected for RNA-seq. Sequencing was performed by using Illumina Hiseq4000 and differentially expressed genes and functional enrichment were analyzed. Findings of this study may provide a theoretical basis for further comprehensive study to understand the functions of the TRIM genes.
1. Materials and methods
1.1 Ethics statement
All experimental animals were handled in strict accordance with the recommendations in the Guide for the Care and Use of Laboratory Animals of the National Institutes of Health. All animal infection tests did not involve any endangered or protected species. Experiments using zebrafish were performed under the approval of the Animal Ethics Committee of Huazhong Agriculture University (HZAU). The infection and dissection experiments were performed under 3-Aminobenzoic acid ethyl ester methane sulfonate (MS-222) (Sigma, USA) anesthesia to minimize fish suffering.
1.2 Gene knockout
According to Ensembl ID (ENSDART00000079207), the genomic sequence of the zebrafish trim47 gene was downloaded from the Ensembl website. The trim47 gene contains 8 exons and 7 introns and a gRNA targeting a portion of the first exon was designed. The sequence was GGAAAATGAGAGGCGATGATG, which was unique to the zebrafish genome. The target sequence was amplified from the wild-type DNA and confirmed by sequencing. Then, gRNA and zCas9 mRNA were synthesized in vitro. The gRNA-zCas9 mRNA complex was micro-injected into one-cell stage zebrafish embryos and PCR was used to identify the P0 embryonic population that generates targeted mutations. The zebrafish of heterozygous P0 generation were crossed with wild type to obtain F1 generation. The genotypes of F1 zebrafish were verified and multiple mutation types were screened according to different types. The selected F1 generation fish were reared separately according to the mutation type. After the F1 generation reached sexually mature, the F2 generation were obtained by inbreeding within type. Recovered homozygotes were identified by cutting the fish tail sequence.
1.3 Total RNA extraction, library construction and sequencing
The TRIM47–/– group and the WT group were set up in the experiment. The brains of the four fish were taken as one sample, and the spleens were the same. Three samples were set for each group, four groups (WT-brain, WT-spleen, TRIM47–/–-brain and TRIM47–/–-spleen) in total, 12 samples in total. Samples (brain and spleen) from zebrafish of TRIM47–/– and wild type were gotten. Tissues were ground to extract RNA, and the RNA integrity was assessed using the nanodrop, Agilent 2100 Bioanalyzer, and ABI StepOne Plus real-time PCR system. Finally, libraries were constructed and RNA-seq was performed using the Illumina HiSeqTM 4000 platform.
1.4 Bioinformatics analysis
Samples were measured using the Illumina Hiseq4000 platform. Some low-quality of sequenced data with linker-contamination, and a total of 361588720 clean reads were obtained. HISAT[18] was used to map clean reads to Danio rerio genome reference. Reconstructed the transcripts with StringTie[19] and compared the reconstructed transcripts with the reference annotation with cuffcompare. Clean reads were mapped to reference using Bowtie2[20], and gene expression level was calculated with RSEM[21]. The DEG was screened according to the NoIseq[22] packaging method. The default criterion for screening DEG are multiples of≥2 and dispersion probability of≥0.8. With the GO annotation result, DEGs were classified according to official classification, and also performing GO functional enrichment using phyper, a function of R. With the KEGG annotation result, DEGs were grouped according to official classification, and pathway functional enrichment was conducted by using phyper, a function of R.
1.5 Quantitative real-time PCR (qRT-PCR) validation
Transcriptional levels of five complement-associated genes (C1q-cln8, C3a, C9, MASP2, HBL4) were detected using qRT-PCR. All the primers used in this study were presented in Tab. 1. The enzyme we used in all qRT-PCR assays was SYBR Green qPCR SuperMix (TaKaRa). The Roche-Light-Cycler R480II real-time detection system (Roche, Germany) was used to detect gene expression levels[23]. We used the reaction system and procedures recommended by the reagent manufacturer and make appropriate adjustments. The reaction volume was 20 μL at 95℃ for 5min, 41 cycles, 94℃ for 15s, 58℃ for 20s, and 72℃ for 20s. Cycling conditions included three parallel experiments to confirm the results. The results were calculated using a 2−ΔΔCt analysis[24], and TBP serves as a reference gene.
Table 1. Primer sequences used for qRT-PCRGene ID Sequence (5′—3′) C1q_cbln8(ENSDARG
00000019294)CCGGTGAAGGGAGTGTACT
TTTTTCTTGTGATGGGCTGC3a(ENSDARG
00000087359)TTTTTGAGTCCAACACCG
TCATCCCATCATAGCAGCC9(ENSDARG
00000016319)GGAAAGAGCATAACAGACCC
CTTCAATACTCCTAGAGCGAMASP2(ENSDARG
00000007988)ACGCAGAGAAGAACGAGAT
ATGAGCAGCGGTGAGAACCHBL3(ENSDARG
00000068220)GGCTCTTCTGCTCCTTCA
CCAGTGGCTCCATCTCTTHBL4(ENSDARG
00000054202)GTGAGGATGAGAATAAAGTGCT
GTTAGTGAAAGTTAGAGGCTGGTBP (ENSDARG
00000014994)TGGAGGAGCAACAGAGGC
TGGCAGGAGTGATAGGCG1.6 Western blot
Western blot was used to detect protein changes. SDS-PAGE gel was prepared. After gel electrophoresis, the protein was transferred to polyvinylidene fluoride membrane (PVDF) (Bio-Rad, USA) using transfer buffer. Following blocking with TBST solution containing 3% bovine serum albumin (BSA) at room temperature for 3h, the membrane was immersed with the primary antibody [TRIM47 polyclonal antibody (1﹕1000 dilution), anti-β-actin (ABclonal, 1﹕10000 dilution)] for 2h at room temperature. After washing three times with TBST solution for 10min each, the membrane was incubated with secondary antibody (anti-rabbit IgG, 1﹕3000 dilution; ABclonal, China) for 45min. Washing three times with TBST buffer for 10min each. Chemiluminescence detection results were used finally.
1.7 Infection experiment
Adult wild-type AB strain male zebrafish were purchased from the China Zebrafish Resource Centre (CZRC) to ensure a clear genetic background and no pathogenic infection. The purchased zebrafish were infected for 7 days after adaptation at 17℃. The TRIM47–/– group and the WT group were set up in the experiment. There were two groups of 30 zebrafish in each group. Intraperitoneal injection of SVCV (ATCC: VR-1390). Using anesthetic before injection, and MEM medium was injected into the control group. The survival rate was calculated.
1.8 Statistical analysis
The results of the analysis of the experimental data were expressed as mean±SEM, and survival rates were compared using two-way ANOVA. For qRT-PCR results analysis, P<0.05 was considered significant and marked with *, and P<0.01 was marked with **, 0.001<P<0.01 with ***, and P<0.001 with ****.
2. Results
2.1 Successful knockout of trim47 in zebrafish
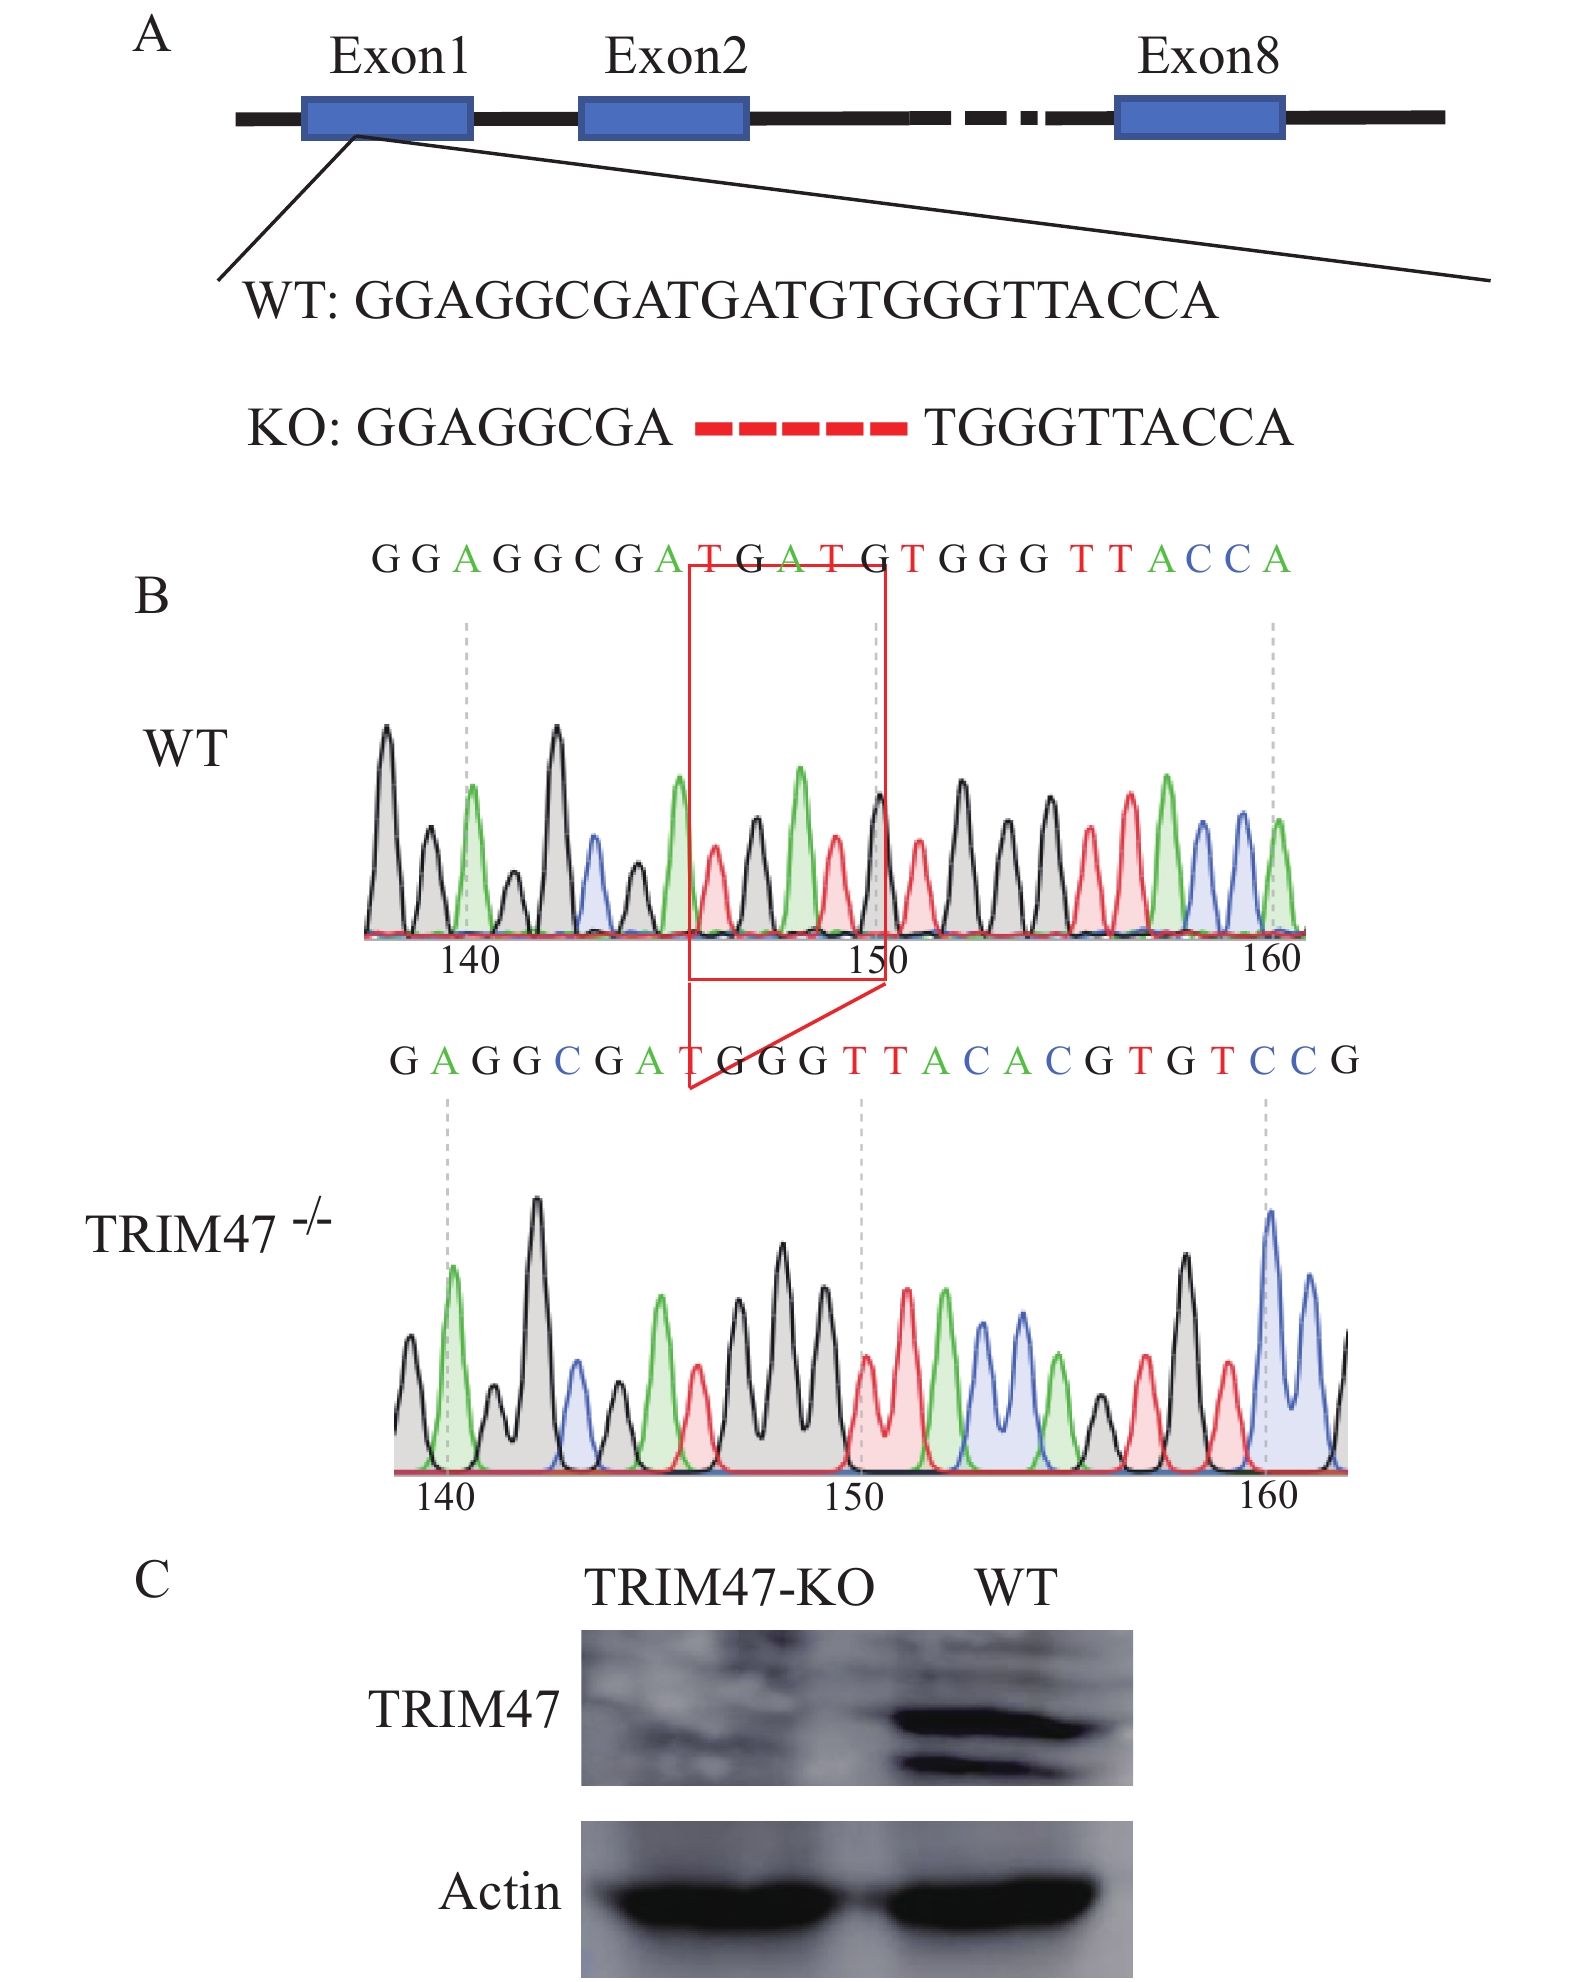
A gRNA target for exon 1 of trim47 was designed and CRISPR/Cas9 was used to knockout trim47. Followed observation revealed no significant difference in growth and reproduction between the two groups. The tails of TRIM47–/– and WT zebrafish were cut off to sequence. One mutant line of trim47 was identified as 5 bp (–5) deletion. Compared with WT, this TRIM47–/– group contains 5 nucleotides (TGATG) deletion at positions 153—157 of the wild-type trim47 coding sequence (Fig. 1A). A peak analysis of the sequencing results was performed and confirmed that both WT zebrafish and mutant TRIM47–/– groups had a single sequencing peak (Fig. 1B). Zebrafish from the TRIM47–/– and the WT groups were taken respectively, and RIPA Lysis Buffer was used to grind the lysed tissue. Trim47 polyclonal antibody was used to detect Trim47 protein. The results showed that the expression of Trim47 protein in TRIM47–/– group was not detectable (Fig. 1C), indicating a successful knockout of the trim47.
![]() Figure 1. Sequencing results of TRIM47–/– and WT groupsA. Targeting strategy for generating mutations in the exon 1 of TRIM47. TRIM47 sequence differences among the one mutant (−5 bp deletion) and wild-type is indicated; B. Sequencing peak results, WT stands for wild-type zebrafish, and TRIM47–/– indicates homozygous zebrafish for knockout TRIM47; C. Detection of TRIM47 protein levels in TRIM47–/– group and WT group
Figure 1. Sequencing results of TRIM47–/– and WT groupsA. Targeting strategy for generating mutations in the exon 1 of TRIM47. TRIM47 sequence differences among the one mutant (−5 bp deletion) and wild-type is indicated; B. Sequencing peak results, WT stands for wild-type zebrafish, and TRIM47–/– indicates homozygous zebrafish for knockout TRIM47; C. Detection of TRIM47 protein levels in TRIM47–/– group and WT group2.2 Transcriptome sequencing summary
All samples were sent to Huada Company for sequencing on the Hiseq4000 platform. The sequencing results were analyzed and summarized in Tab. 2. The sequencing error rate of 95% of bases was less than 1%, and the sequencing error rate of more than 90% of bases was less than 1‰. These data were used as preliminary sequencing results. The high-quality clean readings were then compared to the corresponding reference genome. The genomic localization rates, gene numbers, expressed transcripts and new transcripts for the aligned information and samples were shown in Tab. 3. These results indicated that our sequencing results were accurate and the sequencing quality is high.
Table 2. Summary of the Illumina HiSeqTM 4000 sequencing output for all samplesSample Total raw
reads (Mb)Total clean
reads (Mb)Total clean
bases (Gb)Clean reads
Q20 (%)Clean reads
Q30 (%)Clean reads
Ratio (%)WT-Brain-1 32.66 29.83 4.47 96.91 92.6 91.31 WT-Brain-2 32.66 29.58 4.44 96.98 92.76 90.57 WT-Brain-3 32.66 29.85 4.48 96.82 92.38 91.39 TRIM47–/–-Brain-1 32.66 30.51 4.58 96.44 91.57 93.39 TRIM47–/–-Brain-2 32.66 30.6 4.59 96.28 91.27 93.68 TRIM47–/–-Brain-3 32.66 29.55 4.43 97 92.77 90.46 WT-Spleen-1 32.66 30.46 4.57 97.86 94.64 93.24 WT-Spleen-2 32.66 30.15 4.52 97.63 94.22 92.29 WT-Spleen-3 35.93 30.74 4.61 97.25 93.25 85.55 TRIM47–/–-Spleen-1 32.66 29.45 4.42 96.3 91.3 90.15 TRIM47–/–-Spleen-2 34.3 30.72 4.61 96.4 91.44 89.58 TRIM47–/–-Spleen-3 34.3 30.16 4.52 97.22 93.19 87.95 Table 3. Summary of the transcriptome dataSample Total
mapping
ratio (%)Uniquely
mapping
ratio (%)Total
gene
numberKnown
gene
numberNovel
gene
numberTotal
transcript
numberKnown
transcript
numberNovel
transcript
numberWT-Brain-1 61.48 54.09 21694 20409 1285 33371 25937 7434 WT-Brain-2 60.43 53.25 21379 20087 1292 32480 25197 7283 WT-Brain-3 60.98 53.69 21713 20379 1334 33636 26071 7565 TRIM47–/–-Brain-1 58.02 51.05 21463 20158 1305 33519 25983 7536 TRIM47–/–-Brain-2 56.83 49.91 21399 20097 1302 33313 25804 7509 TRIM47–/–-Brain-3 60.91 53.44 21831 20506 1325 33707 26184 7523 WT-Spleen-1 70.75 55.35 20210 19044 1166 30963 24176 6787 WT-Spleen-2 65.81 44.19 19693 18532 1161 29789 23155 6634 WT-Spleen-3 68.90 50.34 20370 19181 1189 31184 24382 6802 TRIM47–/–-Spleen-1 60.78 42.36 19083 18018 1065 28423 22109 6314 TRIM47–/–-Spleen-2 61.41 45.94 20529 19342 1187 31424 24520 6904 TRIM47–/–-Spleen-3 66.01 47.39 20280 19054 1226 31121 24186 6935 2.3 Analysis of differentially expressed genes
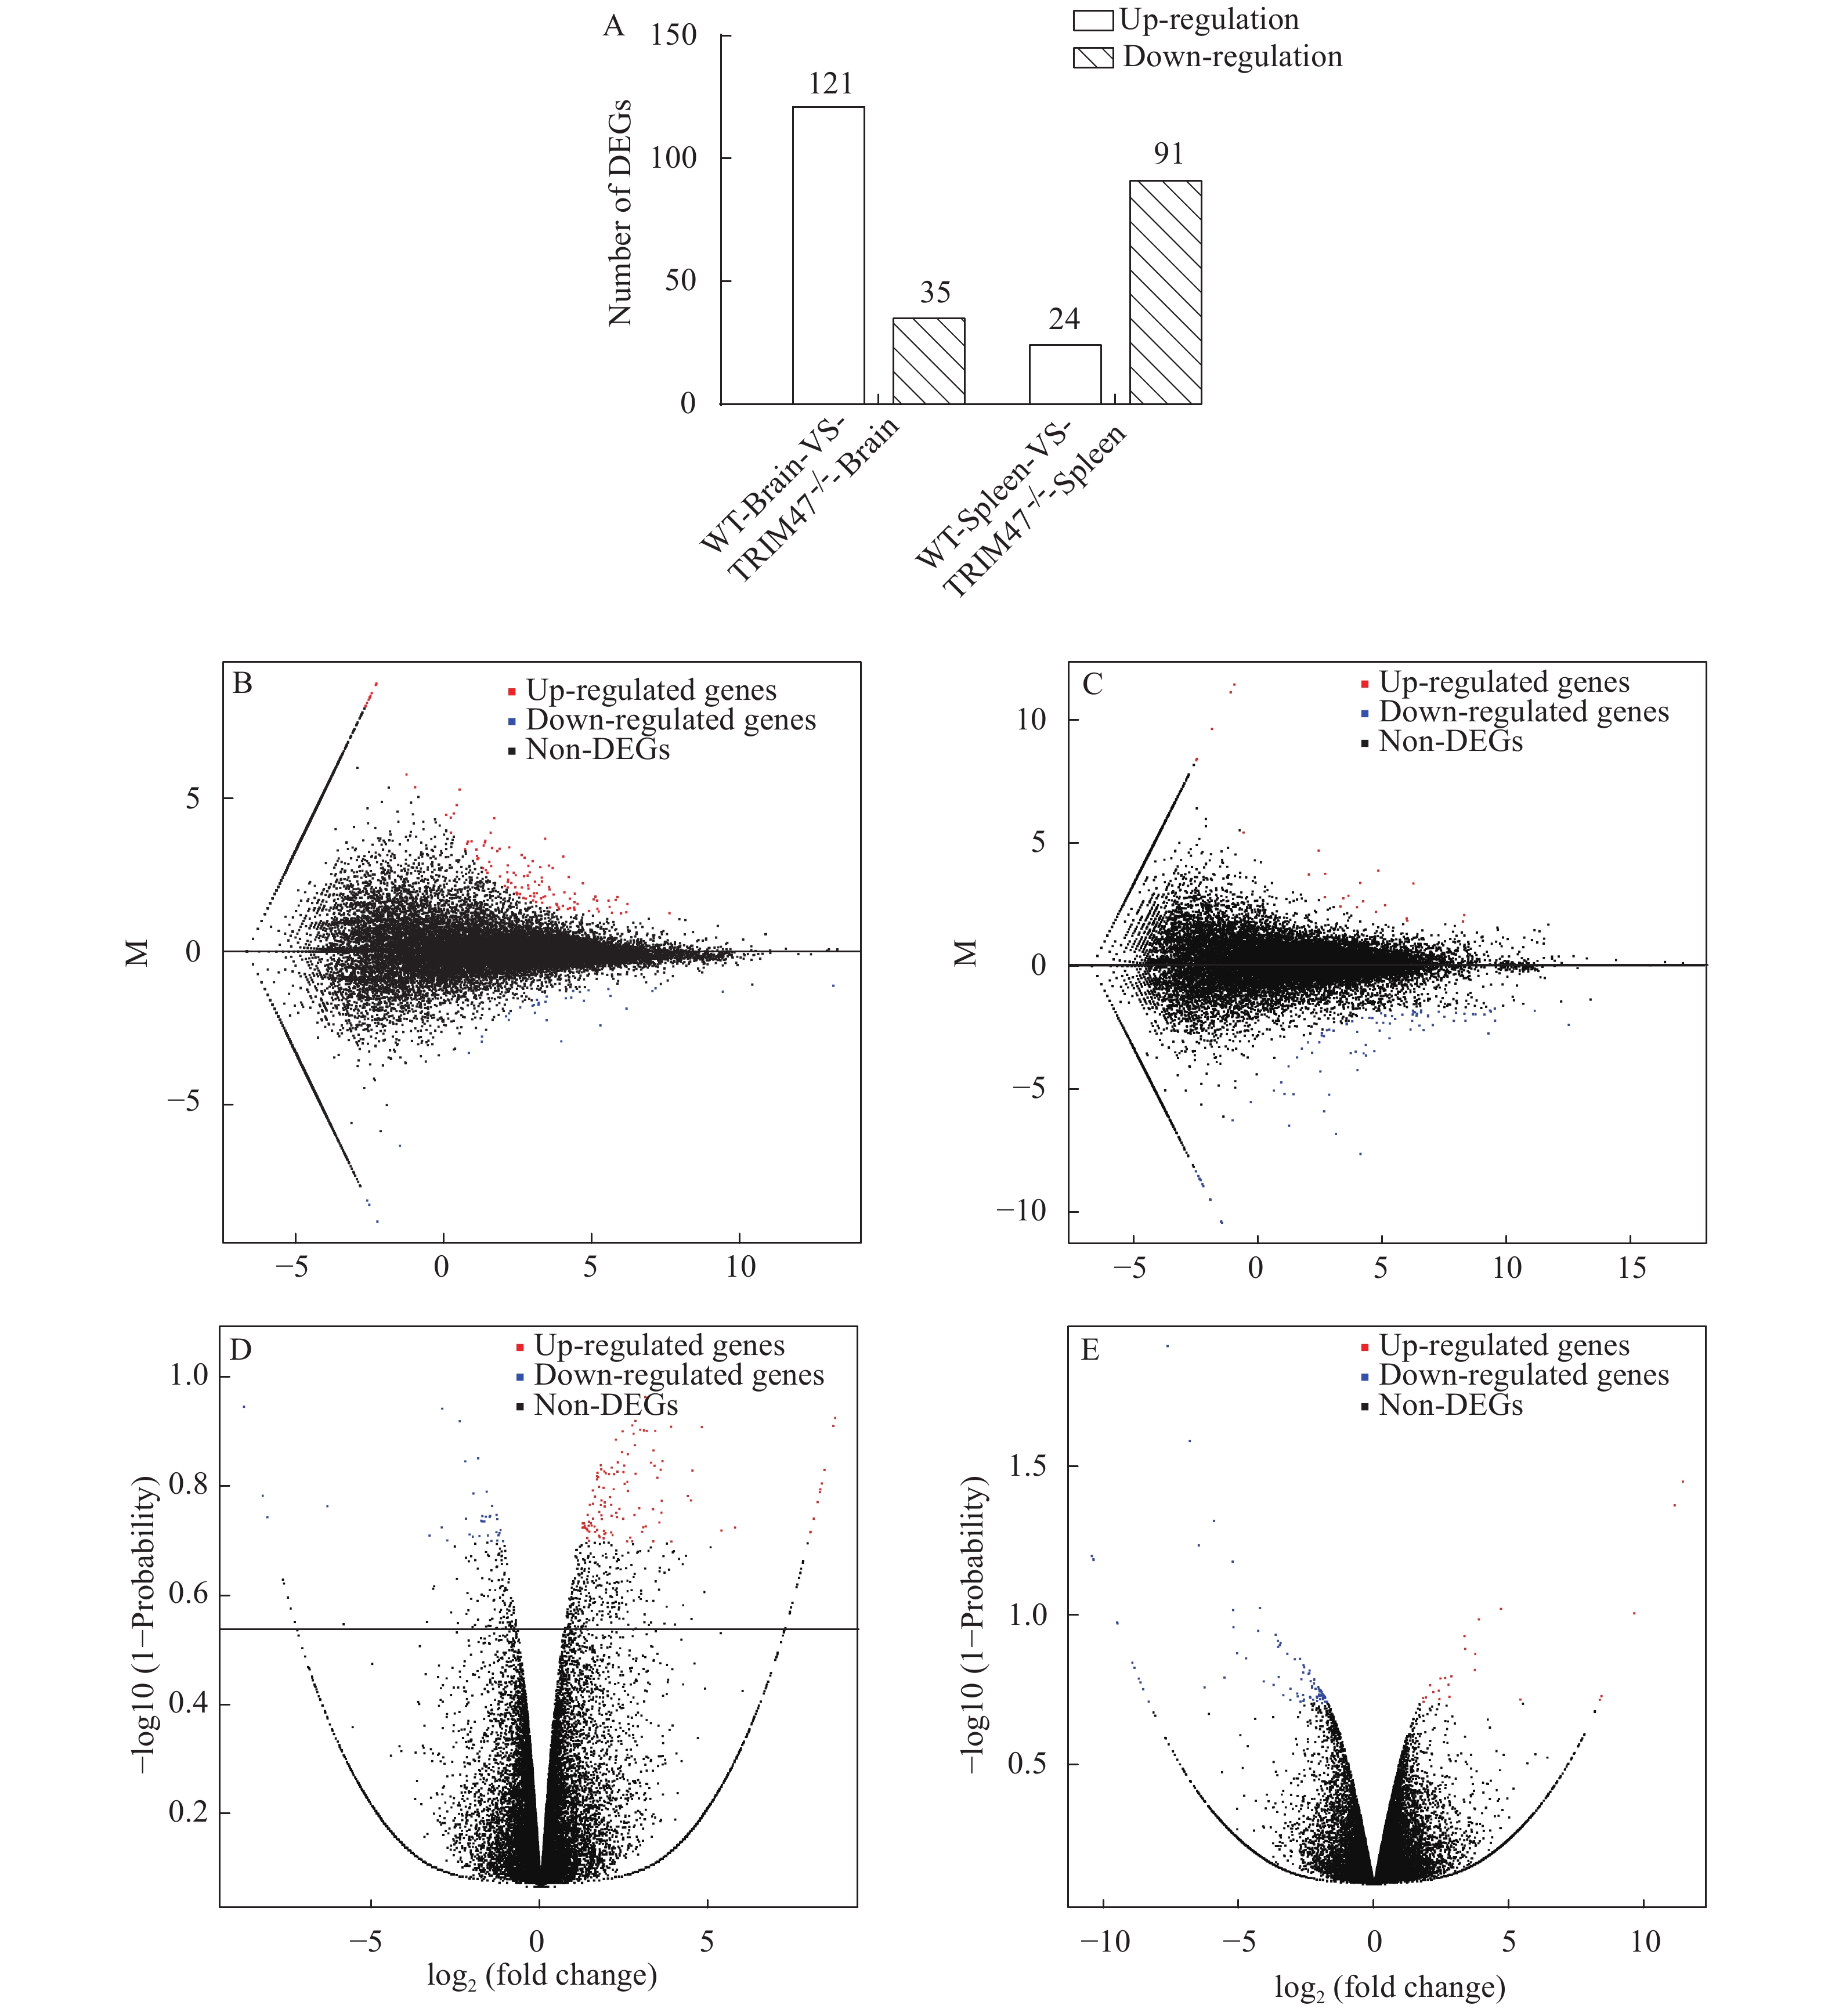
The HISAT was used to compare the control clean reads to the reference genome to obtain a new transcript. Then differentially expressed genes were obtained by analyzing the expression of the transcript. Bioinformatics methods were used for DEGs analysis. As compared to WT group with 156 genes in brain and 115 genes in spleen differentially expressed, there are 121 genes up-regulated and 35 genes down-regulated in brain and 24 up-regulated and 91 down-regulated in spleen, respectively, in TRIM47–/– group (Fig. 2A). Volcanoes and MA maps were identified based on the expression levels of differential genes after knocking out trim47 in brain (Fig. 2B and 2C) and spleen (Fig. 2D and 2E). These results showed that there were significant differences in expression levels of these differentially expressed genes both in the brain and spleen between the two groups after knocking out trim47.
![]() Figure 2. Analyzing DEGs in brain and spleen between TRIM47–/– group and WT groupA. Statistical results of differentially expressed genes in brain and spleen between TRIM47–/– group and WT group. X axis represents comparing samples. Y axis represents DEG numbers. Red color represents up regulated DEGs. Blue color represents down regulated DEGs; B. MA plot of DEGs in brain between TRIM47–/– group and WT group. X axis represents value A (log2 transformed mean expression level). Y axis represents value M (log2 transformed fold change). Red points represent up regulated DEGs. Blue points represent down regulated DEGs. Black points represent non-DEGs; C. MA plot of DEGs in spleen between TRIM47–/– group and WT group. The description of the figure was the same with figure B description; D. The brain of TRIM47–/– group and WT group Volcano plot of DEGs. X axis represents log2 transformed fold change. Y axis represents-lg transformed significance. Red points represent up regulated DEGs. Blue points represent down regulated DEGs. Black points represent non-DEGs; E. The spleen of TRIM47–/– group and WT group Volcano plot of DEGs. The description of the figure was the same with figure D description
Figure 2. Analyzing DEGs in brain and spleen between TRIM47–/– group and WT groupA. Statistical results of differentially expressed genes in brain and spleen between TRIM47–/– group and WT group. X axis represents comparing samples. Y axis represents DEG numbers. Red color represents up regulated DEGs. Blue color represents down regulated DEGs; B. MA plot of DEGs in brain between TRIM47–/– group and WT group. X axis represents value A (log2 transformed mean expression level). Y axis represents value M (log2 transformed fold change). Red points represent up regulated DEGs. Blue points represent down regulated DEGs. Black points represent non-DEGs; C. MA plot of DEGs in spleen between TRIM47–/– group and WT group. The description of the figure was the same with figure B description; D. The brain of TRIM47–/– group and WT group Volcano plot of DEGs. X axis represents log2 transformed fold change. Y axis represents-lg transformed significance. Red points represent up regulated DEGs. Blue points represent down regulated DEGs. Black points represent non-DEGs; E. The spleen of TRIM47–/– group and WT group Volcano plot of DEGs. The description of the figure was the same with figure D description2.4 GO analysis
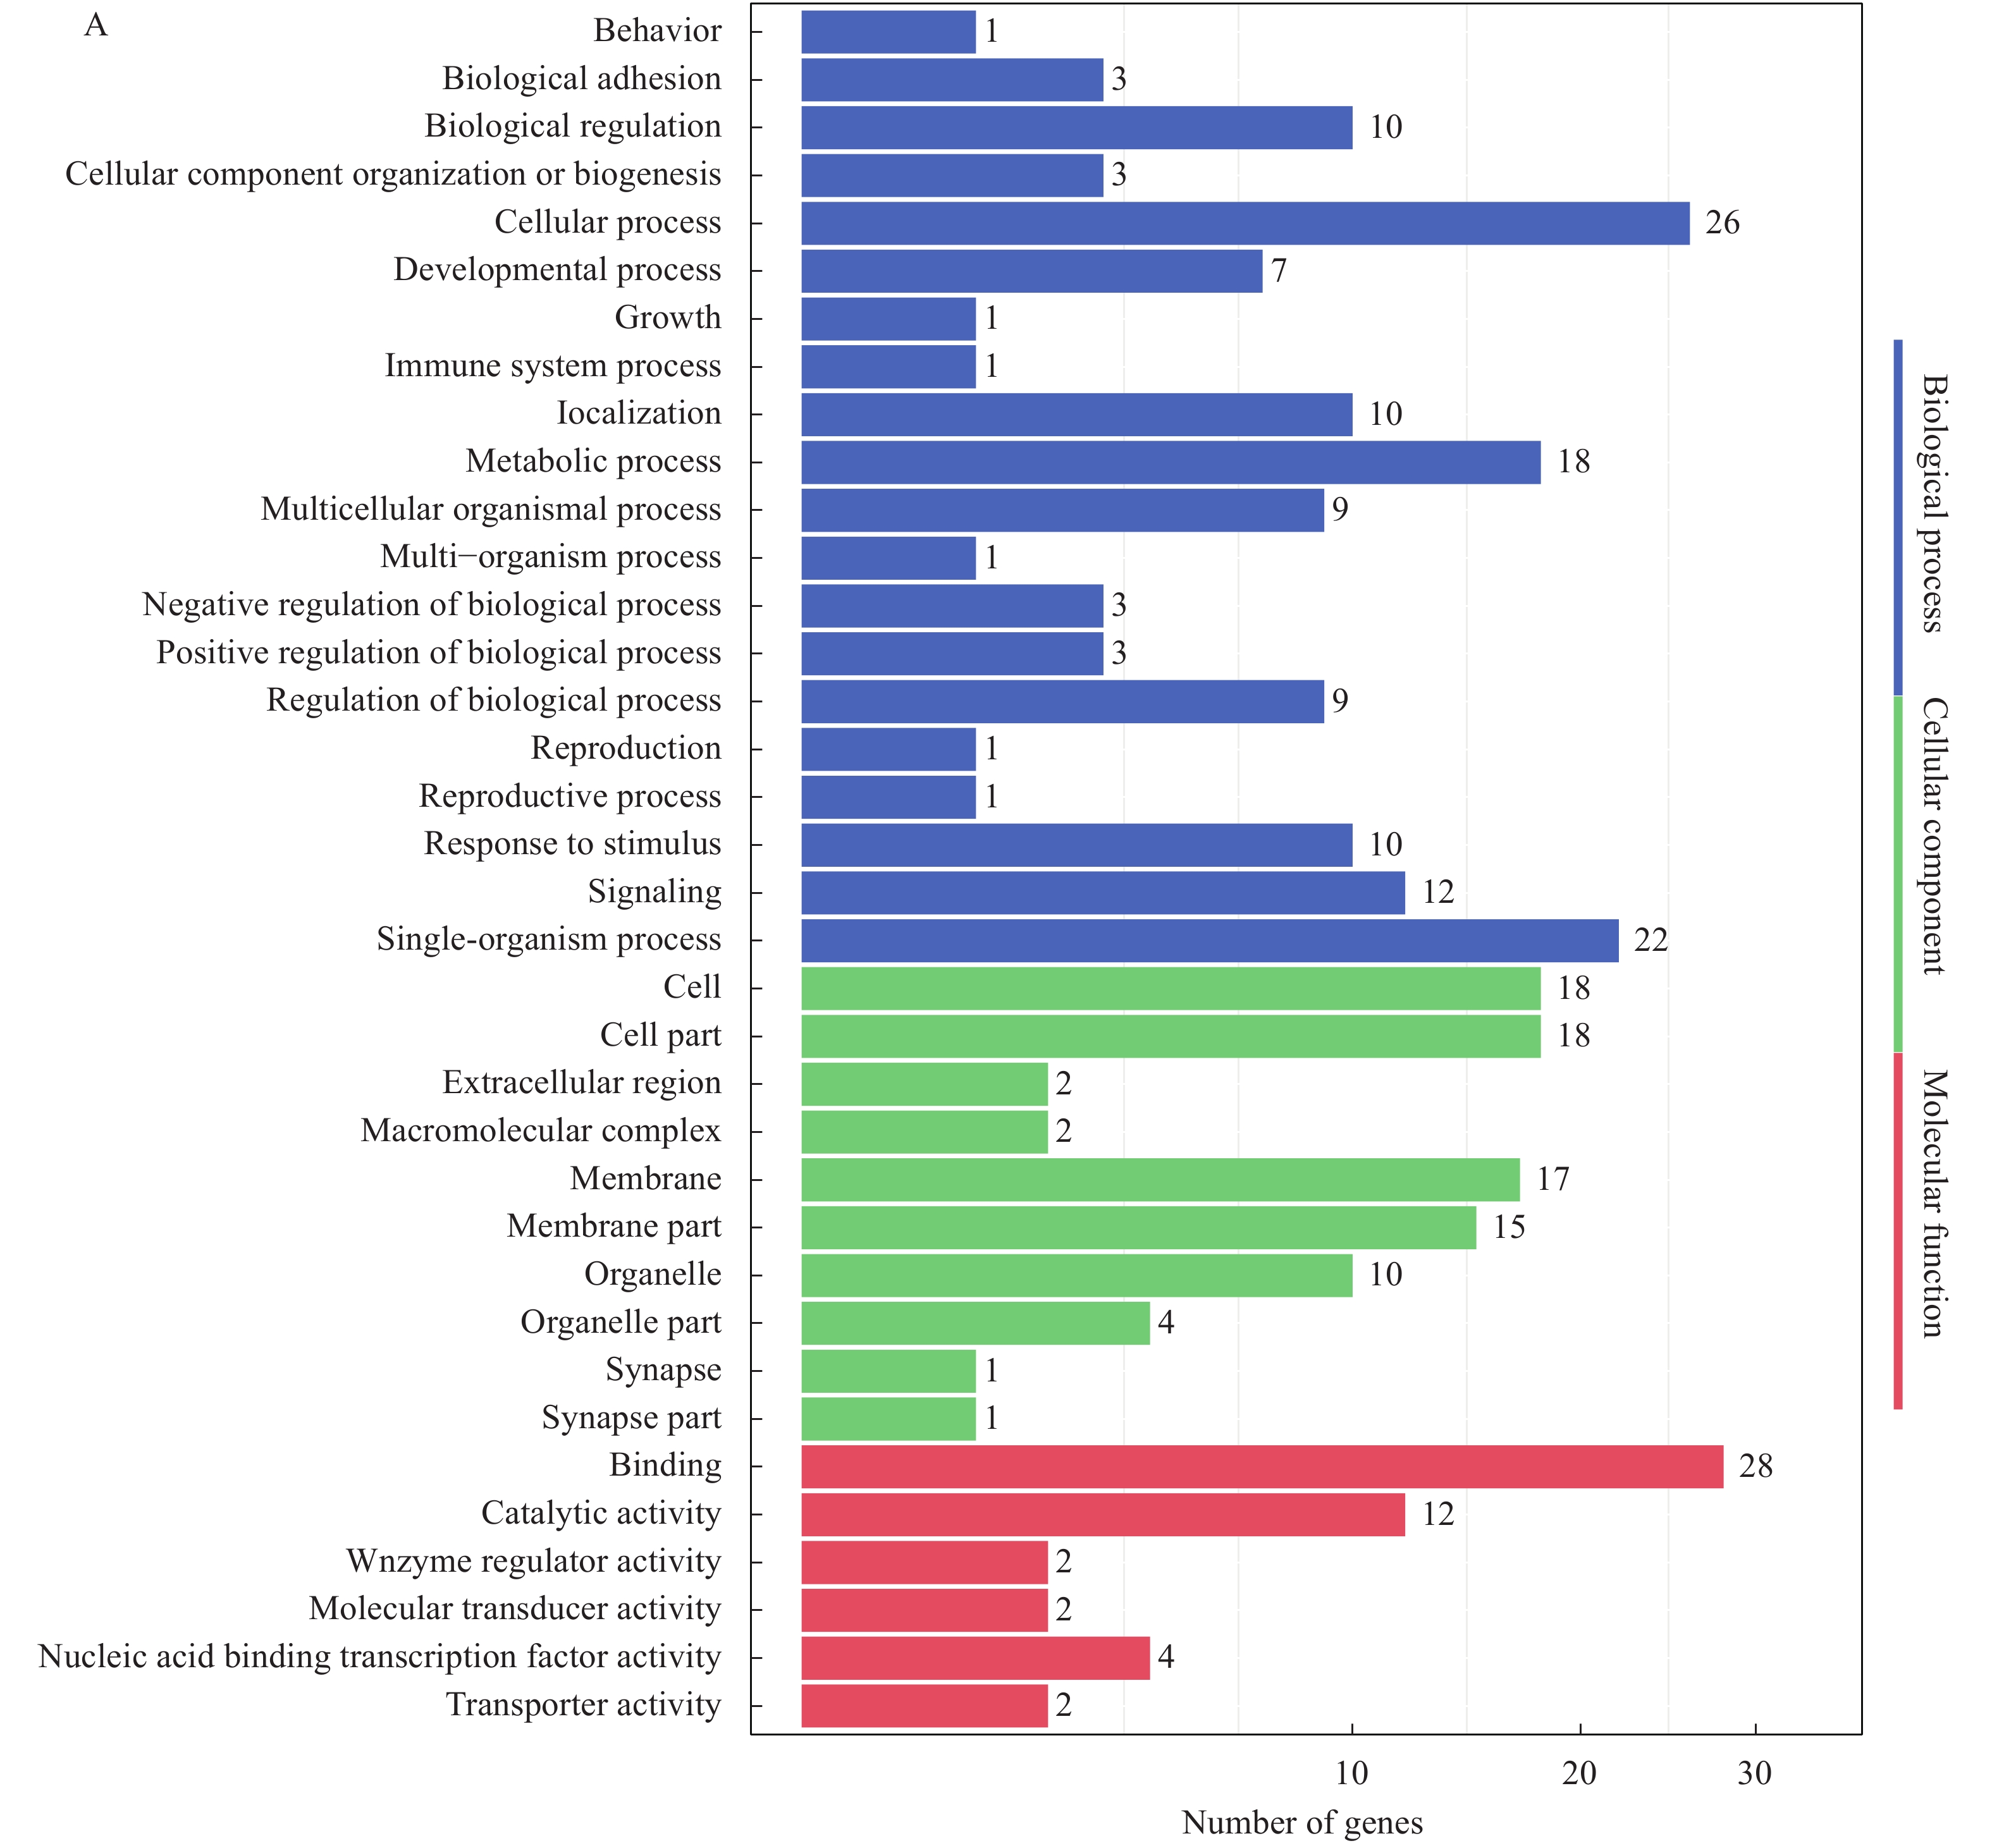
To further understand the function of Trim47, GO functional analysis and hierarchical clustering analysis were performed on differentially expressed genes in brain and spleen between TRIM47–/– group and WT group. After GO analysis, DEGs in brain between TRIM47–/– group and WT group distributed biological process category: cellular process (most), single-organism process (second). In cellular component category: cell (most), cell part (second). And in molecular function category: binding (most), catalytic activity (second) (Fig. 3A). For spleen, biological process category: cellular process, metabolic process. In cellular component category: cell, cell part. In molecular function category binding and catalytic activity (Fig. 3B).
2.5 KEGG pathway enrichment based on DEGs
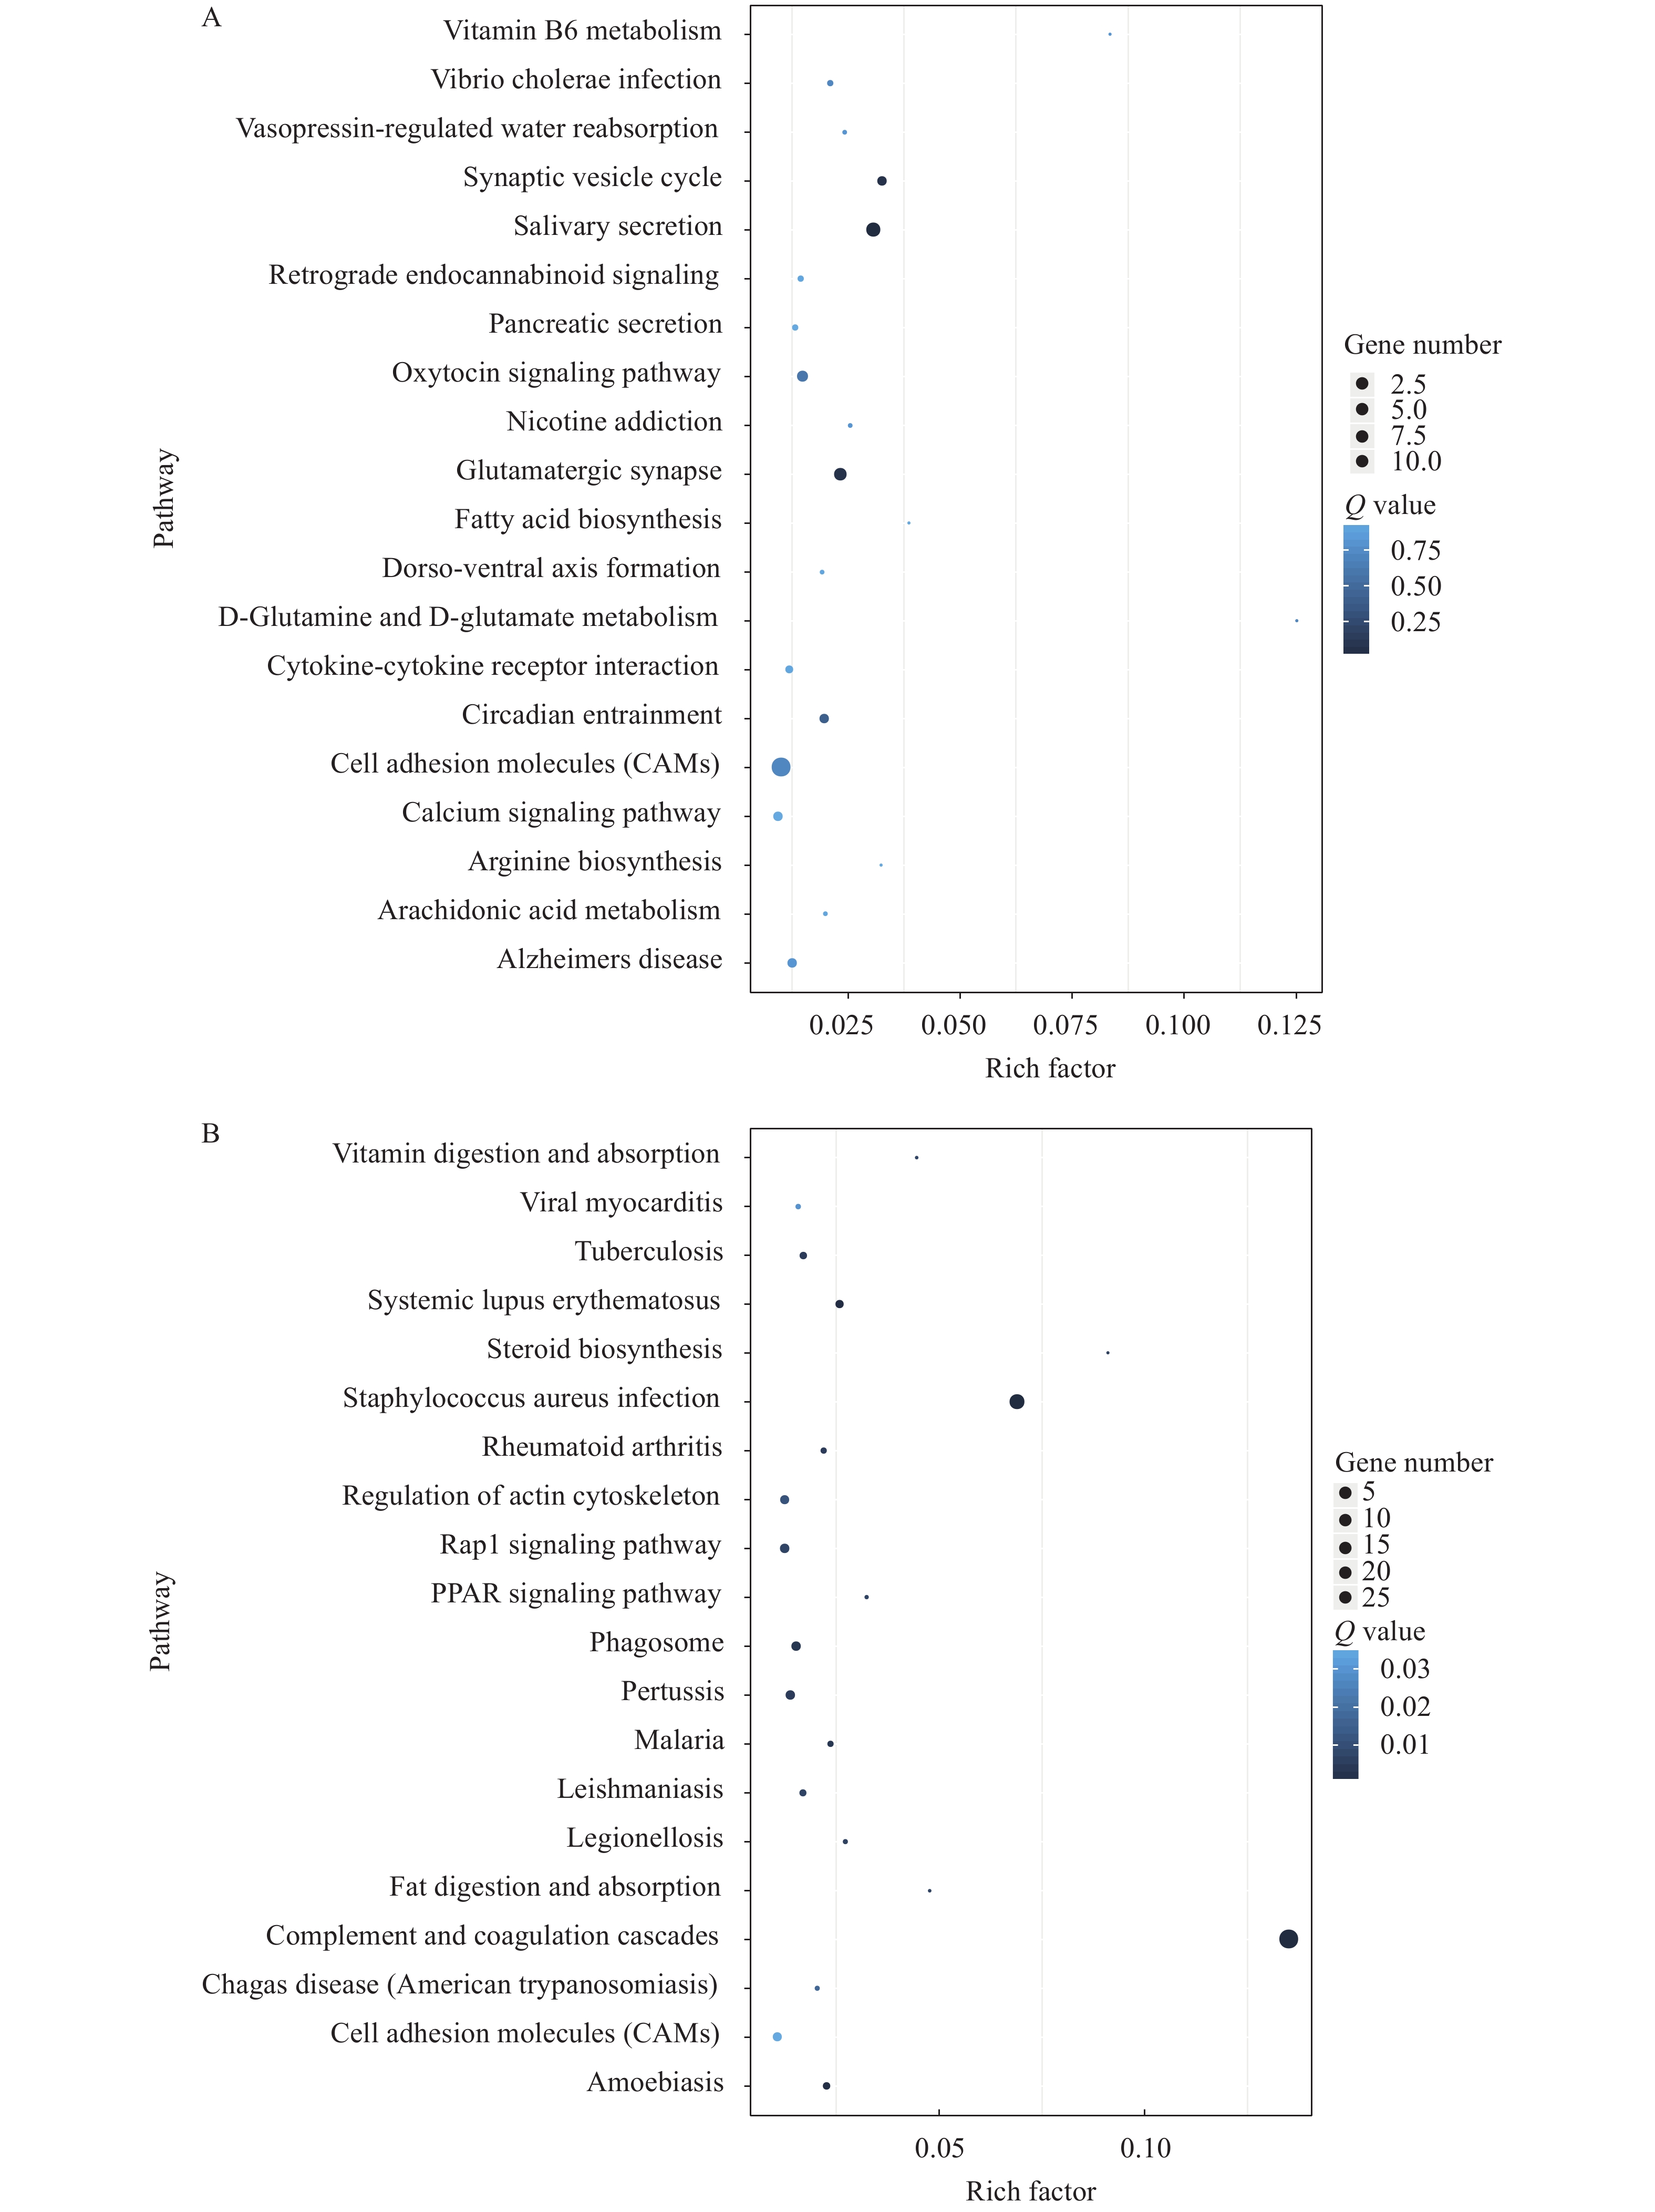
For understanding the genetic information, analysis of differential genes using the KEGG database. The cell adhesion and glutamatergic synapse signaling pathway play an important role in the brain of both TRIM47–/– and WT groups (Fig. 4A). However, complement and coagulation cascades and staphylococcus aureus infection signaling pathway response to trim47 knockout was different in the spleen between TRIM47–/–- and WT-group (Fig. 4B). These results indicated an important function of Trim47 on affecting various life processes. In addition to participating in the cellular process, knocking out test also indicated that Trim47 may exert immune function through complement-related pathways. In order to further study the changes of differential genes in the signaling pathway after knocking out trim47, we performed heat map analysis on cell adhesion and glutamatergic synapse signaling pathway (brain, Fig. 4C) plement and coagulation cascades signaling pathway (spleen, Fig. 4D).
2.6 Validation of DEGs by qRT-PCR
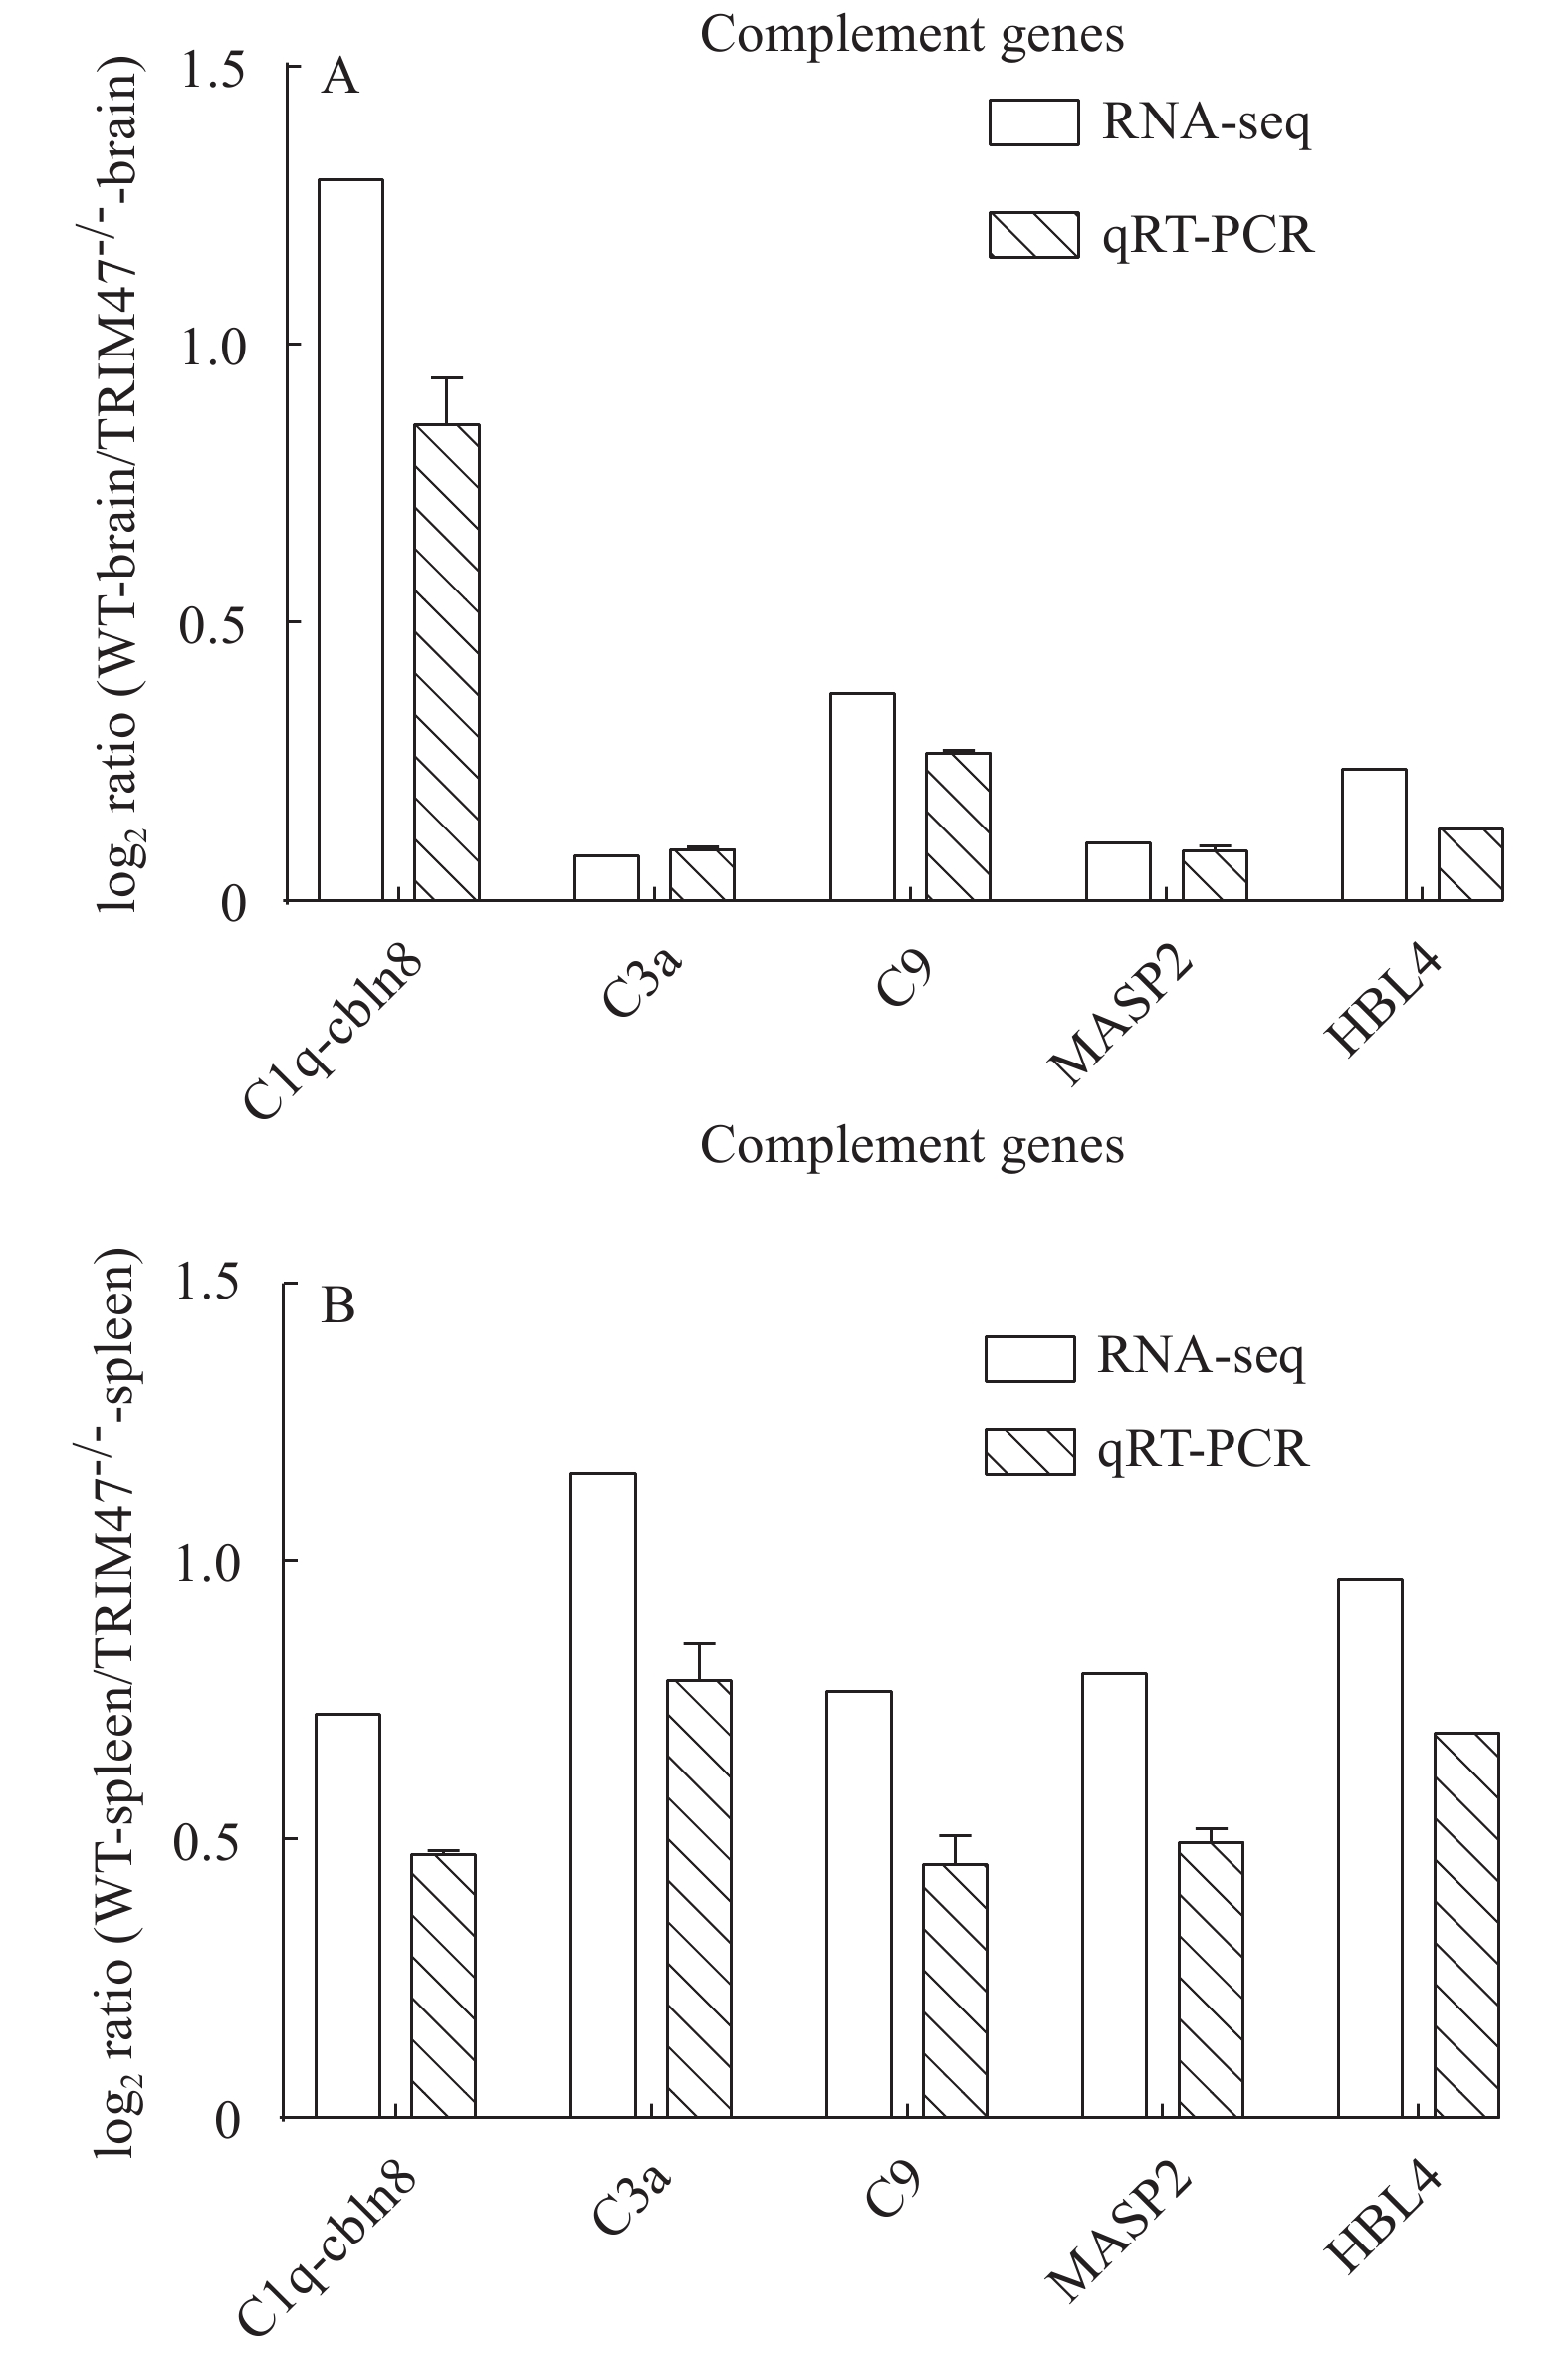
After pathway analysis of the differential genes, the differential genes were validated because of our interest in the enrichment of the complement hemagglutinin pathway after deletion of trim47 in spleen. To further validate this conjecture, some genes related to complement were selected after knocking out trim47 to detect their mRNA expression levels in the brain and spleen. The differential expression levels of the 5 genes associated with complement were comparatively quantified by qRT-PCR between the WT and the TRIM47–/– groups. The fold change of the target genes was compared through the RNA-Seq expression profile and presented in Fig. 5 (A for brain and B for spleen). There was a down-regulation of the gene between the WT and TRIM47–/– groups. The results indicated that the RNA-Seq data was reliable, which further verified the conjecture.
![]() Figure 5. Validation of differentially expressed genes by qRT-PCR in brain (A) and spleen(B) between TRIM47–/– group and WT group
Figure 5. Validation of differentially expressed genes by qRT-PCR in brain (A) and spleen(B) between TRIM47–/– group and WT group2.7 Survival curve
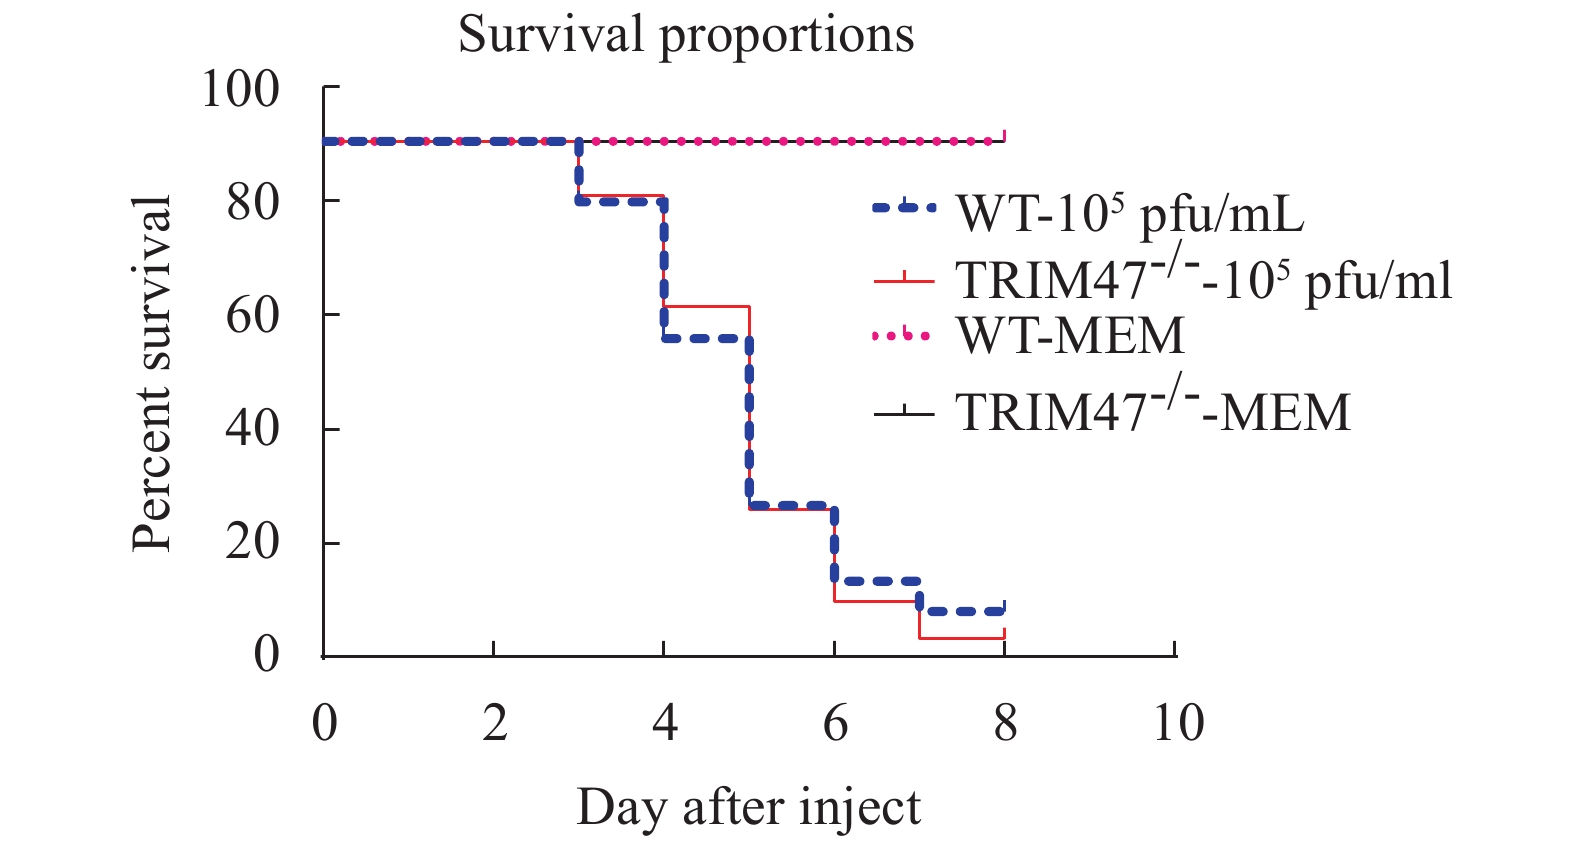
To further determine the role of Trim47 in immunization, survival experiments were performed (Fig. 6). The WT group and TRIM47–/– group zebrafish were intraperitoneally injected with 105 pfu/mL of SVCV, and the control group was injected with 10 μL MEM medium. Based on the pre-experiment results of the previous period and combining the existing publications[25, 26], we finally selected 105 pfu/mL as the infection dose for subsequent experiments. In the virus infection experiment, we can see the typical symptoms of SVCV infection in the infected group. For example, protruding eyeballs, bleeding, bleeding on the body surface, bleeding in the head, and ascites[27]. The uninfected group had no such symptoms. Zebrafish died from the third day, and the death rate accelerated from the third to the fifth day, which was consistent with the report[26]. After 7 days of infection, the zebrafish survival rate in the experimental group was lower than that in the control group.
3. Discussion
In the transcriptome results, 156 up- and 115 down-regulated genes were differentially expressed and detected in the brain and spleen from knocking out trim47, respectively. These differentially expressed genes were enriched into the signaling pathway. After knocking out trim47, cell adhesion and glutamatergic synapse were enriched in the brain, indicating its important role in these cellular processes. In the spleen, these differentially expressed genes were enriched into the complement and coagulation cascades signaling pathway, which was novel and interesting. Complement system is a central component of innate immunity and can function as an important defender against pathogens, which is now known as an essential humoral system of innate immunity as well as a link between innate and adaptive immune responses[28-30]. Complement not only kills pathogenic microorganisms within an organism, but also participates in a variety of humoral and cellular immune responses[31]. Complement can transmit stimulation and inhibition signals to many cell types, regulating multiple life activities of cells, including cellular activation, differentiation, proliferation, cell movement, adhesion, secretion, and programmed death. Complement transmits signals through traditional cell membrane receptors, and signals can also be delivered to cells via membrane regulatory proteins or MAC complexes[32]. We selected complement-associated genes to validate transcriptome data. respectively, for two purposes: to verify the sequencing results and to determine the spleen differential gene enrichment pathway after knocking out TRIM47. it was hypothesized that TRIM47 may function through the complement pathway in the zebrafish spleen.
For infection experiments in zebrafish, we chose to use the SVCV, a virus caused severe disease in common carp[23]. The results showed that there was a difference in the mortality rate after knocking out the trim47. Survival rate test was designed to simulate the influence of infection on survival rate under natural conditions. It is undeniable that after the Trim47 knockout, the susceptibility of zebrafish to SVCV is enhanced, and the mortality rate is higher. But this difference has not reached 50% or more. The function of single gene knockout is limited. Whether to apply the gene knockout technology in the prevention and control of fish diseases requires further research, and whether knocking out a single gene can promote other diseases also needs further investigation.
In summary, the model organism of zebrafish was used as the experimental object in this study, and knocked out trim47 at the individual level, and performed transcriptome analysis. Differential gene analysis, signal pathway analysis, and functional cluster analysis were all performed to characterize the differentially expressed genes. The transcriptome data was validated and the function of Trim47 at the individual level was determined. The zebrafish infection experiments also confirmed that Trim47 played a significant role in the body of the fish. Findings from this study provide some essential basis for future in-depth study to verify the functions of the Trim47 and other TRIM proteins.
-
![]()
Figure 1. Sequencing results of TRIM47–/– and WT groups
A. Targeting strategy for generating mutations in the exon 1 of TRIM47. TRIM47 sequence differences among the one mutant (−5 bp deletion) and wild-type is indicated; B. Sequencing peak results, WT stands for wild-type zebrafish, and TRIM47–/– indicates homozygous zebrafish for knockout TRIM47; C. Detection of TRIM47 protein levels in TRIM47–/– group and WT group
![]()
Figure 2. Analyzing DEGs in brain and spleen between TRIM47–/– group and WT group
A. Statistical results of differentially expressed genes in brain and spleen between TRIM47–/– group and WT group. X axis represents comparing samples. Y axis represents DEG numbers. Red color represents up regulated DEGs. Blue color represents down regulated DEGs; B. MA plot of DEGs in brain between TRIM47–/– group and WT group. X axis represents value A (log2 transformed mean expression level). Y axis represents value M (log2 transformed fold change). Red points represent up regulated DEGs. Blue points represent down regulated DEGs. Black points represent non-DEGs; C. MA plot of DEGs in spleen between TRIM47–/– group and WT group. The description of the figure was the same with figure B description; D. The brain of TRIM47–/– group and WT group Volcano plot of DEGs. X axis represents log2 transformed fold change. Y axis represents-lg transformed significance. Red points represent up regulated DEGs. Blue points represent down regulated DEGs. Black points represent non-DEGs; E. The spleen of TRIM47–/– group and WT group Volcano plot of DEGs. The description of the figure was the same with figure D description
![]()
Figure 5. Validation of differentially expressed genes by qRT-PCR in brain (A) and spleen(B) between TRIM47–/– group and WT group
Table 1 Primer sequences used for qRT-PCR
Gene ID Sequence (5′—3′) C1q_cbln8(ENSDARG
00000019294)CCGGTGAAGGGAGTGTACT
TTTTTCTTGTGATGGGCTGC3a(ENSDARG
00000087359)TTTTTGAGTCCAACACCG
TCATCCCATCATAGCAGCC9(ENSDARG
00000016319)GGAAAGAGCATAACAGACCC
CTTCAATACTCCTAGAGCGAMASP2(ENSDARG
00000007988)ACGCAGAGAAGAACGAGAT
ATGAGCAGCGGTGAGAACCHBL3(ENSDARG
00000068220)GGCTCTTCTGCTCCTTCA
CCAGTGGCTCCATCTCTTHBL4(ENSDARG
00000054202)GTGAGGATGAGAATAAAGTGCT
GTTAGTGAAAGTTAGAGGCTGGTBP (ENSDARG
00000014994)TGGAGGAGCAACAGAGGC
TGGCAGGAGTGATAGGCG 下载: 导出CSV
Table 2 Summary of the Illumina HiSeqTM 4000 sequencing output for all samples
Sample Total raw
reads (Mb)Total clean
reads (Mb)Total clean
bases (Gb)Clean reads
Q20 (%)Clean reads
Q30 (%)Clean reads
Ratio (%)WT-Brain-1 32.66 29.83 4.47 96.91 92.6 91.31 WT-Brain-2 32.66 29.58 4.44 96.98 92.76 90.57 WT-Brain-3 32.66 29.85 4.48 96.82 92.38 91.39 TRIM47–/–-Brain-1 32.66 30.51 4.58 96.44 91.57 93.39 TRIM47–/–-Brain-2 32.66 30.6 4.59 96.28 91.27 93.68 TRIM47–/–-Brain-3 32.66 29.55 4.43 97 92.77 90.46 WT-Spleen-1 32.66 30.46 4.57 97.86 94.64 93.24 WT-Spleen-2 32.66 30.15 4.52 97.63 94.22 92.29 WT-Spleen-3 35.93 30.74 4.61 97.25 93.25 85.55 TRIM47–/–-Spleen-1 32.66 29.45 4.42 96.3 91.3 90.15 TRIM47–/–-Spleen-2 34.3 30.72 4.61 96.4 91.44 89.58 TRIM47–/–-Spleen-3 34.3 30.16 4.52 97.22 93.19 87.95
下载: 导出CSV
Table 3 Summary of the transcriptome data
Sample Total
mapping
ratio (%)Uniquely
mapping
ratio (%)Total
gene
numberKnown
gene
numberNovel
gene
numberTotal
transcript
numberKnown
transcript
numberNovel
transcript
numberWT-Brain-1 61.48 54.09 21694 20409 1285 33371 25937 7434 WT-Brain-2 60.43 53.25 21379 20087 1292 32480 25197 7283 WT-Brain-3 60.98 53.69 21713 20379 1334 33636 26071 7565 TRIM47–/–-Brain-1 58.02 51.05 21463 20158 1305 33519 25983 7536 TRIM47–/–-Brain-2 56.83 49.91 21399 20097 1302 33313 25804 7509 TRIM47–/–-Brain-3 60.91 53.44 21831 20506 1325 33707 26184 7523 WT-Spleen-1 70.75 55.35 20210 19044 1166 30963 24176 6787 WT-Spleen-2 65.81 44.19 19693 18532 1161 29789 23155 6634 WT-Spleen-3 68.90 50.34 20370 19181 1189 31184 24382 6802 TRIM47–/–-Spleen-1 60.78 42.36 19083 18018 1065 28423 22109 6314 TRIM47–/–-Spleen-2 61.41 45.94 20529 19342 1187 31424 24520 6904 TRIM47–/–-Spleen-3 66.01 47.39 20280 19054 1226 31121 24186 6935
下载: 导出CSV
-
[1] Meroni G, Diez-Roux G. TRIM/RBCC, a novel class of ‘single protein RING finger’ E3 ubiquitin ligases [J]. Bioessays, 2005, 27(11): 1147-1157. doi: 10.1002/bies.20304
[2] Qiu Y, Liu P, Ma X, et al. TRIM50 acts as a novel Src suppressor and inhibits ovarian cancer progression [J]. Biochimica et Biophysica Acta-Molecular Cell Research, 2019, 1866(9): 1412-1420. doi: 10.1016/j.bbamcr.2019.06.002
[3] Zhou L, Deng Z Z, Li H Y, et al. TRIM31 promotes glioma proliferation and invasion through activating NF-kappaB pathway [J]. Onco Targets and Theraphy, 2019(12): 2289-2297.
[4] Langevin C, Levraud J P, Boudinot P. Fish antiviral tripartite motif (TRIM) proteins [J]. Fish and Shellfish Immunology, 2019(86): 724-733.
[5] Wang Y, Li Z, Lu Y, et al. Molecular characterization, tissue distribution and expression, and potential antiviral effects of trim32 in the common carp (Cyprinus carpio) [J]. International Journal of Molecular Sciences, 2016, 17(10): 1693. doi: 10.3390/ijms17101693
[6] Fujimura T, Inoue S, Urano T, et al. Increased expression of tripartite motif (TRIM) 47 is a negative prognostic predictor in human prostate cancer [J]. Clinical Genitourinary Cancer, 2016, 14(4): 298-303. doi: 10.1016/j.clgc.2016.01.011
[7] Wang Y, Kuang M, Lu Y, et al. Characterization and biological function analysis of the TRIM47 gene from common carp (Cyprinus carpio) [J]. Gene, 2017(627): 188-193.
[8] Carroll M C. The complement system in regulation of adaptive immunity [J]. Nature Immunology, 2004, 5(10): 981-986. doi: 10.1038/ni1113
[9] Carroll M V, Sim R B. Complement in Health and Disease [M]. Leicester: Kluwer Academic Publishers, 1993: 39-42.
[10] Barton G M, Medzhitov R. Toll-like receptors and their ligands [J]. Current Topics in Microbiology & Immunology, 2002(270): 81-92.
[11] Jr C A J, Medzhitov R. Innate immunity: Lipoproteins take their Toll on the host [J]. Current Biology, 1999, 9(23): R879. doi: 10.1016/S0960-9822(00)80073-1
[12] Li L, Hu S, Chen X. Non-viral delivery systems for CRISPR/Cas9-based genome editing: challenges and opportunities [J]. Biomaterials, 2018(171): 207-218.
[13] Chen C, Fenk L A, De Bono M. Efficient genome editing in Caenorhabditis elegans by CRISPR-targeted homologous recombination [J]. Nucleic Acids Research, 2013, 41(20): e193. doi: 10.1093/nar/gkt805
[14] Li D, Qiu Z, Shao Y, et al. Heritable gene targeting in the mouse and rat using a CRISPR-Cas system [J]. Nature Biotechnology, 2013, 31(8): 681. doi: 10.1038/nbt.2661
[15] Ansai S, Kinoshita M. Targeted mutagenesis using CRISPR/Cas system in medaka [J]. Biology Open, 2014, 3(5): 362-371. doi: 10.1242/bio.20148177
[16] Hai T, Teng F, Guo R, et al. One-step generation of knockout pigs by zygote injection of CRISPR/Cas system [J]. Cell Research, 2014, 24(3): 372-375. doi: 10.1038/cr.2014.11
[17] Ni W, Qiao J, Hu S, et al. Efficient gene knockout in goats using CRISPR/Cas9 system [J]. PLoS One, 2014, 9(9): e106718. doi: 10.1371/journal.pone.0106718
[18] Kim D, Langmead B, Salzberg S L. HISAT: a fast spliced aligner with low memory requirements [J]. Nature Methods, 2015, 12(4): 357-360. doi: 10.1038/nmeth.3317
[19] Pertea M, Pertea G M, Antonescu C M, et al. StringTie enables improved reconstruction of a transcriptome from RNA-seq reads [J]. Nature Biotechnology, 2015, 33(3): 290-295. doi: 10.1038/nbt.3122
[20] Langmead B, Salzberg S L. Fast gapped-read alignment with Bowtie 2 [J]. Nature Methods, 2012, 9(4): 357-359. doi: 10.1038/nmeth.1923
[21] Li B, Dewey C N. RSEM: accurate transcript quantification from RNA-Seq data with or without a reference genome [J]. BMC Bioinformatics, 2011, 12(1): 323-323. doi: 10.1186/1471-2105-12-323
[22] Tarazona S, Garcia-Alcalde F, Dopazo J, et al. Differential expression in RNA-seq: a matter of depth [J]. Genome Research, 2011, 21(12): 2213-2223. doi: 10.1101/gr.124321.111
[23] Wang Y, Zhang H, Lu Y, et al. Comparative transcriptome analysis of zebrafish (Danio rerio) brain and spleen infected with spring viremia of carp virus (SVCV) [J]. Fish & Shellfish Immunology, 2017(69): 35-45.
[24] Livak K J, Schmittgen T D. Analysis of relative gene expression data using real-time quantitative PCR and the 2(-Delta Delta C(T)) Method [J]. Methods (
San Diego, Calif. ) , 2001, 25(4): 402. doi: 10.1006/meth.2001.1262 [25] Sanders G E, Batts W N, Winton J R. Susceptibility of Zebrafish (Danio rerio) to a model pathogen, spring viremia of carp virus [J]. Comparative Medicine, 2003, 53(5): 514-521.
[26] Lopez-Munoz A, Roca F J, Meseguer J, et al. New insights into the evolution of ifns: zebrafish group II IFNs induce a rapid and transient expression of IFN-dependent genes and display powerful antiviral activities [J]. Journal of Immunology, 2009, 182(6): 3440-3449. doi: 10.4049/jimmunol.0802528
[27] Ahne W, Bjorklund H, Essbauer S, et al. Spring viremia of carp (SVC) [J]. Diseases of Aquatic Organisms, 2002, 52(3): 261-272.
[28] Kemper C, Pangburn M K, Fishelson Z. Complement Nomenclature 2014 [J]. Molecular Immunology, 2014, 61(2): 56-58. doi: 10.1016/j.molimm.2014.07.004
[29] Mueller-Ortiz, Stacey, L, et al. Innate and adaptive immunologic functions of complement in the host response to Listeria monocytogenes infection [J]. Immunobiology Zeitschrift Fur Immunitatsforschung, 2016, 221(12): 1407-1417. doi: 10.1016/j.imbio.2016.07.004
[30] Liao Z W, Wan Q Y. The systematic identification and mRNA expression profiles post viral or bacterial challenge of complement system in grass carp Ctenopharyngodon idella [J]. Fish & Shellfish Immunology, 2019(86): 107-115.
[31] Morgan B P. Complement membrane attack on nucleated cells: resistance, recovery and non-lethal effects [J]. Biochemical Journal, 1989, 264(1): 1-14. doi: 10.1042/bj2640001
[32] Shen Y, Meri S. Yin and Yang: complement activation and regulation in Alzheimer’s disease [J]. Progress in Meurobiology, 2003, 70(6): 1-472.
计量
- 文章访问数: 1712
- HTML全文浏览量: 472
- PDF下载量: 98